2.1Economic Growth Limits
Chapter 1 demonstrated that the laws of physics and mathematical logic render a constant few-percent growth trajectory to be absurd and untenable even a few hundred years into the future. In this chapter, we develop implications for the less physics-bound concept of economic growth, which is a cornerstone of modern society. Investment, loans, retirement and social security schemes all assume the march of growth. The conclusion of this chapter is that economic growth will not be able to continue at any significant rate in the absence of physical growth—which we have seen cannot continue indefinitely. The suggestion usually evokes quick criticism from economists, but they can be talked down, with patience.[1] This is how it goes.
2.2Historical Coupling
In subsistence times, esthetics held little value compared to physical goods: you couldn’t eat a sculpture, for instance—nor would it help keep you warm.[2] Food, tools, resources like wood, pack or draft animals carried primary value. When basic subsistence requirements were met, gold or jewelry may have warranted some expenditure—but even these were physical resources.Agriculture freed some individuals in society to think and create. The economy found more room to value arts and performance: things that fueled the mind, if not the body. During the Renaissance, patrons would support artists and scientists whose output had few other channels of economic support. In today’s world, a complex economy distributes financial assets to a wide variety of practitioners in general accordance with society’s values.
But resources are still paramount. The United States prospered largely because it possessed a frontier rich in natural resources. Mining and animal pelts dominated early on, as well as agriculture (tobacco, cotton, corn, wheat). In the middle of the 20th century, the United States was the dominant oil exporter worldwide (first developed in Pennsylvania, then California and Texas). One might say that the U.S. was the Saudi Arabia of the day. Escaping the World Wars largely unscathed in terms of domestic infrastructure, the country had tooled-up a massive manufacturing capability. Together with a can-do attitude, Americans set out to rack up superlatives in virtually every category. As a manufacturing powerhouse during the middle of the 20th century, American raw materials joined a well-educated workforce to drive innovation and production. It is no accident that many in the U.S. yearn to return to these “glory days;” however we cannot possibly do so, having permanently depleted some of the original stocks. It is important to recognize that the past was not “glorious” for all people.
What was true in the past is largely still true today: resources like oil, steel, metals, agricultural products, and heavy machinery continue to fetch a significant price on the market. Resources fuel prosperity. It is not the only source, but remains a reliable and bedrock component. Figure 1 shows the tight correlation between economic scale and energy use, which is often expressed by saying that the two tend to be coupled.
![Per capita energy use as a function of GDP on a logarithmic scale. Per capita GDP is the sum total of a country's economy divided by population, effectively indicating average annual income. The rate at which an individual uses energy is expressed as a power, in Watts. A strong correlation exists here across many orders-of magnitude: rich countries use more energy, per person [@wikiGDP; @wikienergyconsumption; @wikipopulation]. A few instructive cases (red dots) are labeled. The dot areas are scaled to population.](/HumanAmbitions/build/_page_37_Figure_3-26862a86c0bbe164d2c21309a259ae03.jpeg)
Figure 1:Per capita energy use as a function of GDP on a logarithmic scale. Per capita GDP is the sum total of a country’s economy divided by population, effectively indicating average annual income. The rate at which an individual uses energy is expressed as a power, in Watts. A strong correlation exists here across many orders-of magnitude: rich countries use more energy, per person Wikipedia, 2025Wikipedia, 2025Wikipedia, 2025. A few instructive cases (red dots) are labeled. The dot areas are scaled to population.
One way to capture the physical connection to economic activity is to represent the energy expenditure associated with each dollar[3] spent. This economic energy intensity of a country is just the energy expenditure of society divided by the gross domestic product (GDP).[4]
Energy intensity therefore provides a measure of how resource-heavy a country is in relation to the size of its economy. For instance, the U.S. uses about 1020 Joules of energy per year and has a GDP of approximately 20 trillion dollars. Dividing these gives an intensity of , or (many variants are possible in terms of units). The world as a whole uses about in a year at an estimated $90 trillion gross world product, also resulting in . The variation among developed countries is not especially large—generally in the single-digit MJ range.
We will cover units of energy in Chapter 5. For now, it is sufficient to know that a Joule (J) is a unit of energy, and that MJ means megajoules, or 106 J.
Figure 2 illustrates the range of intensities for all the countries in the world. Among the factors driving energy use are geographical extent (large countries require more long-haul transportation), climate (cold countries require more heating), efficiency, and lifestyle. Russia, Canada, and the U.S. have large territories, and the former two require more heating than most. By contrast, Switzerland is geographically small and outsources much of its heavy industry. Somebody should probably check on what’s happening in Venezuela.[5]
![Energy intensity of countries, on a log–log plot. The vertical axis shows how energetically "hungry" each country is in relation to its economic output, while the horizontal axis sorts countries by economic output per person. A few instructive cases (red dots) are labeled. The dot areas are scaled to population. Prosperous countries tend to have lower intensity than developing countries, but part of this may relate to moving manufacturing from the former to the latter [@wikiGDP; @wikienergyconsumption; @wikipopulation].](/HumanAmbitions/build/_page_38_Figure_5-677ef6bce91a75a0235b72a3cec0a4c7.jpeg)
Figure 2:Energy intensity of countries, on a log–log plot. The vertical axis shows how energetically “hungry” each country is in relation to its economic output, while the horizontal axis sorts countries by economic output per person. A few instructive cases (red dots) are labeled. The dot areas are scaled to population. Prosperous countries tend to have lower intensity than developing countries, but part of this may relate to moving manufacturing from the former to the latter Wikipedia, 2025Wikipedia, 2025Wikipedia, 2025.
2.3Decoupling and Substitution
As economies expand beyond subsistence level, a larger fraction of the total activity can go to “frivolous” elements, such as art and entertainment. The intensity of such activities can be quite low. An art collector may pay $1 million for a coveted painting. Very little energy is required. The painting was produced long ago. It may even remain on display in the same location—only the name of the owner changing. Financial transactions that require no manufacture, transport, and negligible energy are said to be “decoupled” from physical resources. Plenty of examples exist in society, and are held up by economists as illustrating how we can continue to expand the economy without a commensurate expansion of resource needs.[6]
The dream is that as development progresses, economic energy intensity may decline (greater decoupling) so that more money is made per unit of energy expended. If the economy can decouple from energy needs, we are not constrained in our quest to continue economic growth, bringing smiles to the faces of investors and politicians. Such a transition would mean less emphasis on energy and resource-intensive industrial development/manufacturing, and more on abstract services,[8] broadly speaking.
Because the world is a sort of “experiment,” representing many countries having adopted many policies and in various states of development, Figure 2 can be viewed as a potential roadmap to decoupling. Part of the reason prosperous countries demonstrate a lower intensity is that manufacturing moves overseas. Driving the whole world toward lower intensity is a more difficult prospect, as the physical processes must still happen somewhere.
The question is: as countries develop and become more prosperous, does intensity decrease, as we would want it to do as a signal of decoupling? On the large scale, any effect is modest. Going from India to the U.S. affords only a factor-of-two improvement in intensity, while spanning most of the horizontal extent in personal prosperity (a factor of 30 in per capita GDP).[9] That’s pretty weak tea.
At the upper end of personal income (right side of Figure 2, we might detect a downward slope. But we must be careful about cherry-picking in the face of non-replicable circumstances. Not every country can assume the geography and financially-focused nature of Switzerland. And at the same time, if the U.S. imagines itself providing a model that other countries might emulate, the intensity of many European countries could actually increase if adopting U.S. habits. But more broadly, we don’t have evidence that a country on the prosperous end of the distribution can operate at even a factor-of-four lower intensity than the 4 MJ/$ level typical of developed countries. In the present context of assessing the future of growth, in which we are concerned with order-of-magnitude scales and limits (as in Chapter 1), it does not appear that decoupling has very much to offer.[10]
The past is full of examples of substitution. Consider the progression in lighting technology from open fires to beeswax candles to whale oil lanterns to piped gas lanterns to incandescent electric bulbs to fluorescent lights to LED (light emitting diode) technology. Every step seems to be an improvement, and it is very natural to assume the story will continue developing along these lines. Through this example, we can see how substitution and decoupling might be connected: efficiency improves through substitution, requiring less energy for the same lighting value.
Table 1:Luminous efficacies Energypedia, 2015Wikipedia, 2015
| Light Source | lm/W |
|---|---|
| Candles | ~0.3 |
| Gas Lamp | 1–2 |
| Incandescent | 8–15 |
| Halogen | 15–25 |
| CFL | 45–75 |
| LED | 75–120 |
![Historical progress of lighting efficiency on a logarithmic plot, using bars to indicate the approximate range of time and performance. The dashed line at top represents the maximum theoretical luminous efficacy for white light (no waste heat). The dotted line rises by our customary factor of ten per century (2.3% annual rate). Note that the guiding line reaches the theoretical maximum mid-century (red star), indicating that this centuries-long ride cannot continue much longer [@energypedia_lights; @wiki_luminous].](/HumanAmbitions/build/_page_41_Figure_1-66282e03a636c9f97c2addc29914f7be.jpeg)
Figure 3:Historical progress of lighting efficiency on a logarithmic plot, using bars to indicate the approximate range of time and performance. The dashed line at top represents the maximum theoretical luminous efficacy for white light (no waste heat). The dotted line rises by our customary factor of ten per century (2.3% annual rate). Note that the guiding line reaches the theoretical maximum mid-century (red star), indicating that this centuries-long ride cannot continue much longer Energypedia, 2015Wikipedia, 2015.
The historical progress can fool us into thinking that we can expect a continued march to better substitutes. Having witnessed a half-dozen rabbits come out of the hat[12] in the example of lighting technology (A Story of Lighting Efficiency) we are conditioned to believe more are forthcoming. It will be true until it isn’t any more (e.g., see Figure 3) One way to put it is that 6 rabbits does not imply an infinite number. We should welcome each new rabbit, but not hinge our future on a continual stream of new rabbits.
We will return to this theme in the context of fossil fuels which might be termed the mother of all rabbits, in this context. Having pulled such a stupendous rabbit out of the hat once, many assume we’re set from now on. In this case, equating one to infinity is even more dubious.
For financially secure individuals at the top end of the wealth distribution, it is easier to buy into the allure of substitution as a way forward. Many have achieved wealth from humble beginnings, and have therefore lived a life of continual upgrades in terms of housing, transportation, clothing, food, travel, etc. Even those who have been surrounded by wealth their whole lives have been in a position to afford new upgrades as they become available. Yet, it is not always possible to export the capabilities of those at the top to a significant sector of the population. Not everything can scale.
An electric car having hundreds of kilometers of range seems like an obvious path forward beyond fossil fuels. But at a price tag above $40,000, it does not look like much of a solution to most people, and we can’t be sure prices will fall steeply. Appendix D.4 covers electrified transportation in more detail.
More generally, sometimes the best possible solution and “peak” technology arrives at some early point in history. As much as we mess around with elements on the Periodic Table, we are never going to beat H2O as a vital substance.[13] Marketers might sell H2O2 as superior, having one more beneficial oxygen atom, but please don’t drink hydrogen peroxide! Some technologies in use today would be recognized by pre-industrial people: wheels, string, bowls, glass, clothing. We won’t always find better things, though we may make a series of incremental improvements over time. Not everything will experience game-changing developments.
In summary, decoupling and substitution are touted as mechanisms by which economic growth need not slow down as energy and other resources become constrained. We can make money using less of the resource (decoupling) or just find alternatives that are not constrained (substitution), the thinking goes. And yes, this is backed up by loads of examples where such things have happened. It would be foolish to claim that we have reached the end of the line and can expect no more gains from decoupling or substitution. But it would be equally foolish to imagine that they can produce dividends eternally so that economic growth is a permanent condition.
2.4Physically Forced Economic Limits
Let us now consider a thought experiment. We will use Figure 4 as a guide as we go along. Colored numbers in the following text point to similarly-colored labels in the figure. We start by positing a constant growth rate for the entire economy (point 1; red curve in Figure 4 following the familiar 2.3% annual growth rate, picked for its convenient factor of 10 each century. Meanwhile, the scale of physical resources (energy, materials) in the economy also climbs at the same rate, starting at point 2. The vertical gap between the curves at the left-hand edge conveys that the economy is not 100% physical in the beginning: the total economy is larger than the physical piece.[18]
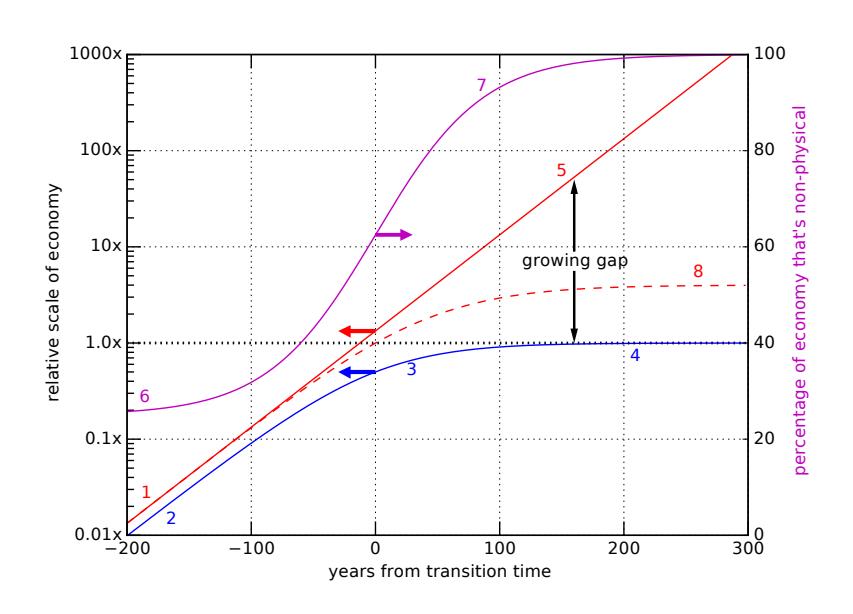
Figure 4:Model evolution of the economy after physical resources saturate. The blue curve is the scale of the physical economy (leveling out, or saturating). The solid red curve is the total economic scale, which we force to adhere to a constant growth rate (10× per century, or 2.3% annual rate). The magenta curve is the percentage of the economy in non-physical sectors, and the red dashed curve is a more realistic reaction of the economy to a saturating physical sector. Colored arrows point to the scale that each curve should use—logarithmic on the left for economic scales and linear on the right for the percentage curve. This model is constructed simply to illustrate the overall behavior: time scales and other quantitative details should not be taken literally.
Fast-forward to a time when physical resources have stopped growing, starting at point 3. Chapter 1 using energy and thermodynamics as the basis—made the case that we cannot expect physical growth to continue indefinitely, ending on a few-century timescale at the longest.[19] In this scenario, the scale of energy in our society flat-lines at a steady scale (point 4).
If we demand continued economic growth in the context of fixed energy, decoupling becomes increasingly necessary, shown as a growing gap in Figure 4 In other words, if the gross domestic product GDP as an indicator of economic activity) is to continue rising[20] (point 5), then overall intensity (energy per dollar) must continually decrease. For this to happen, less-energetic activities must assume increasing importance in the economy. So far, economists are on board: this is precisely what inspires an affinity for decoupling—a way forward in the face of physical limits. One might expect more abstract services, virtual experiences, art dealing, enhanced presentation: all requiring little or no additional energy expenditure, or perhaps even less than before. In this way, the economic scale could keep rising while physical resources are held flat.
If the economy is to continue to expand on the basis of decoupled activities, a greater fraction of it must go toward these non-physical sectors. This means more monetary flow is associated with low-impact activities. In practical terms, then, a greater fraction of one’s income is directed toward experiences not tied to energy or other physical demands. In Figure 4 we see, at point 6, the percentage of the economy in the non-physical sector starting at 25%: not dominant, but not negligible. The magenta curve must rise as the red and blue lines separate, until at point 7 it approaches 100% non-physical and continues to drive arbitrarily close to 100%.
During this process, the obvious converse consequence is that the energetically or physically costly activities—like transportation, food, heating, cooking, manufactured items—become an ever-smaller fraction of the economy, or an ever smaller fraction of monthly expenses, to put it more personally. In other words, they become cheap. This, we will argue, is unrealistic.
Now, in our imagined scenario of continued economic growth, the ruthlessness of the exponential grabs the reins and drives the gulf ever wider, so that physical goods become arbitrarily cheap and demand an ever-smaller fraction of income. Again, seems unrealistic. By the time we reach the right side of Figure 4 the economic scale is over 1000 times as large as the physical scale, meaning that the physical component is less than 0.1% of the total economy. Table 2 illustrates the progression under the foregoing growth rate of 2.3%. If in the year 2000, 50% of one’s income (and thus about half of one’s work hours) goes toward physically intense products, this becomes ever smaller until by the end of the table it only takes 6 minutes of your annual work to earn enough for the physically intense goods: all your food, clothing, transportation, heating, cooking, manufactured goods. Clearly an absurd result.
Table 2:Cost of physical goods.
| Year | % income | hours |
|---|---|---|
| 2000 | 50% | 1000 |
| 2100 | 5% | 100 |
| 2200 | 0.5% | 10 |
| 2300 | 0.05% | 1 |
| 2400 | 0.005% | 0.1 |
If this is starting to feel like unrealistic fantasy, then good: your intuition is serving you well. How can essential, non-negotiable, life-sustaining commodities that are in finite supply become essentially free? The idea goes against another, more fundamental economic principle of supply and demand. A limited life-essential resource will always carry a moderately high value. Limited supply and inflexible demand dictate a floor to the price.
Once the price floor is reached, the cost of physical resources will not be able to fall any further. This happens pretty soon after physical resources cease to grow in scale. Indeed, it seems unlikely (to the author) that limited resources essential for survival would fall much below 10% of the total economic scale, which happens within a century of physical saturation in our 2.3% growth scenario. What seems like a reasonable lower limit to you? How economically insignificant can essentials be and still make sense? Point 8 in Figure 4 depicts a more realistic trajectory for the economy (red dashed line) in reaction to a saturated physical scale. In this case, the economy keeps growing a bit more than the physical sector, but eventually settles down itself into a non-growth phase.
We therefore have a logical sequence providing a few-century timescale for an end to economic growth. Thermodynamics limits us to at most a few centuries of energy growth on Earth, and economic growth will cease within a century or so thereafter, assuming a target rate of a few percent per year. In practice, growth may come to an end well before theoretical extremes are reached.
2.5No-Growth World
The foregoing arguments spell out why economic growth cannot be expected to continue indefinitely—contrary to prevalent assumptions. When a mathematically-framed model delivers nonsense results—like the one we used to extrapolate energy use to absurd extremes—it does not mean the math itself is wrong, just that it has been misapplied or layered onto faulty assumptions. In this case, the breakdown indicates that the assumption of indefinite growth is untenable.
The growth regime is woven deeply into our current global society. And why wouldn’t it be? We’ve enjoyed its benefits for many generations. We celebrate the myriad advantages it has brought, and therefore align our political and economic institutions toward its robust preservation. Community planning, interest rates, investment, loans, the very role of banks, social safety net systems,[21] and retirement plans all hinge on are examples. the assumption of growth.[22] Shock waves of panic reverberate at signs of (even temporary) recession, given the importance of growth to our institutions. Yet the message here is that we cannot expect its unfaltering continuance—implying that many things will have to change.
Returning to the roots of economic theory, the earliest thinkers—Adam Smith, David Ricardo, Thomas Malthus, John Stuart Mill—had foundations in natural philosophy[23] and saw growth as a temporary phase, ultimately limited by a prime physical resource: land. In that time, land held the key to outputs from farming, timber, mining, and game—thereby dictating economic development. What these pioneering economic thinkers did not foresee was the arrival of fossil fuels, and the technological developments that accompanied this energy explosion.
Now, we have fallen into something of a lulled complacency: having rescued ourselves so far from the end-of-growth predictions of the early economists, the temptation is to conclude that they were just wrong[24], and we have outsmarted natural limits. This is dangerous thinking. In the end, nature is indifferent to how smart we imagined ourselves to be. If we were truly clever, we would start thinking about a world that does not depend on growth, and how to live compatibly within planetary limits. Chapter 19 touches on this theme, after intervening chapters paint a more complete picture of energy constraints.
2.6Upshot: Economic Growth Will End
It is worth re-iterating the recipe for an end to economic growth in summary form, as spelled out in Economic Growth Limit Make sure you can trace the logic and connections from one point to the next—not to be memorized as disconnected facts.
As was stated before, experts frequently read complex sections more than once to fully absorb the arguments; feel free to do so here.
Just because we can point to some completely legitimate examples of decoupled activities and many impressive substitution stories does not mean that an entire economy can be based on indefinite continuance of such things. We are physical beings in a physical world and have non-negotiable minimum requirements for life. The activities and commodities that support critical functions cannot continue to expand indefinitely, and will not become arbitrarily cheap once their expansion hits physical limits. The finite nature of our world guarantees that such limits will be asserted, committing economic growth to stall in turn. Nothing, in the end, escapes physics.
So, while acknowledging that growth in the past has brought uncountable benefits to the human endeavor, we have to ask ourselves: If the end of growth is inevitable, why does it remain our prevailing plan?
2.7Problems
- At a 3.5% growth (interest) rate, how much would $1,000 invested at the time Columbus sailed to America be worth today (hint: use the rule of 70)? Put this in context (compare to richest individuals or find a similar GDP for some country).
- As an indication of how sensitive the accumulation is to interest rate, compare the result from Problem 1 to what would happen for interest rates of 4% and 5% — again putting into context.
- Find the energy intensity for at least four countries spanning a range of development levels. For each country, look up the GDP, and find energy consumption at: Wikipedia page on Primary Energy Consumption or Gapminder. In order to compare to Figure 2 you may need to convert units. Also note that a trillion is 1012.
- Estimate the energy intensity of the UCSD campus, based on an annual electricity expenditure around 1015 J.[26] side, assume that student payments (tuition, fees, room and board) accounts for 40% of the total budget.[27] Use your knowledge of typical tuition/fees and enrollment to come up with a number. Compare your result to global figures for energy intensity. Don’t get hung up on in-state fraction; just make a crude guess (maybe guess an average) and clearly state assumptions.
- Typical energy costs are in the neighborhood of $0.10 per kilowatthour (kWh), and 1 kWh is 3.6 MJ (megajoules). Take the ratio of these two figures to form an economic energy intensity of energy itself, in units of MJ/$. The result should be larger than the typical energy intensity for all economic activities within a country, since not all monetary expenditure goes toward energy.
- If a country clocks in at 5 MJ/$ for its overall energy intensity, and its energy costs work out to an energy intensity of 30 MJ/$,[28] what percentage of the economy do we infer constitutes the energy sector? The answer should be well less than 100%.
- Come up with some of your own examples (at least three; not listed in the text) of economic activities[29] that have little resource footprint and are therefore fairly decoupled. These are transactions for which the intensity (energy or resource expenditure) is very low compared to the dollar amount.
- If a candle has a luminous efficacy of 0.3 lm/W and a modern LED light bulb achieves 100 lm/W, by what factor[30] have we improved lighting efficiency? If the theoretical limit is around 300 lm/W, what factor do we still have to go?
- In going from 0.3 lm/W candle technology to the theoretical maximum luminous efficacy, we see a factor of 1000 increase. Taking about 300 years to do this, we might recognize that we are following along our familiar factor-of-ten each century trajectory. Approximately how long might we expect it to take to achieve the final factor of three to go from our current technology to the theoretical limit, at this same rate? Is it within your lifetime that we hit the limit? You can just estimate, use appropriate math, or refer to the guiding line in Figure 3 to arrive at a rough number.
- Provide your own example of a sequence of substitutions comprised of at least two qualitatively superior substitutions over (thus three steps: original, first replacement, second replacement). These examples are perhaps defined by widespread or universal adoption or replacement.
- List three substances or critical concepts we rely on that have no superior substitutes in the universe.
- Based on your present state of knowledge, detail what you think an optimist might say about the superiority of post-fossil energy substitutes? You might pick any subset of solar, wind, hydroelectric, geothermal, nuclear, etc. to guide your thinking.
- Based on your present state of knowledge, detail what you think a pessimist might say about the lack of superiority of post-fossil energy substitutes?
- Justify what, in your mind, is a reasonable lower limit to the percentage of the economy that could be based on decoupled (not energy or resource heavy) activities? Make an argument for what leads you to this “floor.”
- One form of decoupled activity that some will bring up is virtual reality: you can travel the world (or solar system?) without resourcehogging transportation and other material costs. Do you see this as a viable alternative that is likely to largely supplant physical travel? Why or why not?
- Are you sold on the argument that the physics-imposed limit to resource/energy growth demands an ultimate cessation of economic growth as well? If so, highlight the persuasive elements. If not, why not?
- coupled
- refers to the tight connection often seen between energy/resource use and economic scale (as measured, for instance, by GDP.
- GDP
- Gross Domestic Product, effectively representing the total monetary flow of goods and services within a society, typically over a one year period.
- Joule
- (J) is the SI unit of work or energy, and is equivalent to Newtons times meters (N·m), or kg · m2</sup/s2 .
- SI
- Système International.
- Newtons
- (N) is the SI unit of force, and is equivalent to .
- photon
- the smallest indivisible particle of light: a minimum quantum packet of energy. Each photon has a well defined energy, which can also be expressed as a wavelength or frequency.
- Watts
- (W) is a unit of power, defined so that 1 W is 1 J/s (one Joule per second).
- Doubling times
- how long it takes a system or collection to double its amount under conditions of growth, such as in exponential growth. See also the rule of 70.
- Jevons Paradox
- named after early economist William Stanley Jevons, and describes the backfire of efficiency improvements leading to increased usage of the associated resource due to greater demand for the more attractive, efficient technology. Also called the rebound effect.
- rebound effect
- describes the counterintuitive process by which efficiency improvements lead to greater use of the resource as the enhanced appeal and lower cost results in more widespread adoption and use. Also called the Jevons paradox.
See, for instance Murphy, 2012.
Life, it turns out, is a struggle against thermodynamics.
Or converted monetary equivalent.
GDP is a measure of total monetary value of goods and services produced in a country within a year.
Maybe they left the oven on by mistake?
This is the hope, anyway.
Services, like plumbing, journalism, or marketing fall in between, using some physical resources, but not as much as heavy industry.
Such services might include things like singing lessons, life coaching, psychotherapy, financial planning, and other activities broadly that demand little physical input.
$65,000 vs. $2100 for the U.S. and India, respectively.
That is, no orders-of-magnitude that will allow us to continue growth for centuries more after physical resources limit growth.
. . . magician reference
Relatedly, consider that the Periodic Table is finite and fits easily on a single sheet of paper (Figure B.1). We don’t have an unlimited set of substitute elements/compounds available. Astrophysical measurements validate that the whole universe is limited to the same set of elements.
... meaning 30% one year might be 30.3% next year (not 31%, which would be a ~3% improvement)
...e.g., in basements or garages or offices
... thus some room for services.
It is assumed here (optimistically) that we have managed to find a renewable alternative that can satisfy a constant demand effectively indefinitely. If not, the story is even worse and we are forced to ramp down the scale of the physical sector, which would force the blue curve in Figure 4 to descend in later years.
... and not artificially via inflation, but in terms of real value
In the U.S., Social Security and Medicare are examples.
Growth in both workforce and investments are essential ingredients of these schemes that pay out more than an individual’s past contributions to the program.
... closer to modern-day physics than to modern-day economics, rooted in the natural world
The classic example is Thomas Malthus, who warned of limits over 200 years ago based on finite resource limits before fossil fuels ripped the narrative apart. The lasting association is that “Malthus equals wrong,” leading to the dangerous takeaway that all warnings in this vein are discredited and can be ignored. Note that the most consequential and overlooked lesson from the story about “the boy who cried wolf” is that a real wolf did appear.
... which, let’s be clear, we’re arguing is ultimately not at all viable...
Based on a 30 MW electrical load times the number of seconds in a year; this won’t account for all energy expenditures, missing For the financial transportation, for instance.
Federal grants comprise most of the rest, and a small amount from state taxes.
In the same sense as was calculated for Problem 5.
... things that cost money
A factor is just a multiplicative scale: e.g., 24 is a factor of 6 larger than 4.
- Wikipedia. (2025). List of countries by GDP (nominal). https://en.wikipedia.org/wiki/List_of_countries_by_GDP_(nominal)
- Wikipedia. (2025). List of Countries by Total Primary Energy Consumption and Production. https://en.wikipedia.org/wiki/List_of_countries_by_total_primary_energy_consumption_and_production
- Wikipedia. (2025). List of Countries by Population (United Nations). https://en.wikipedia.org/wiki/List_of_countries_by_population_(United_Nations)
- Murphy, Jr., Thomas W. (2012). Maximum spectral luminous efficacy of white light. Journal of Applied Physics, 111(10), 104909. 10.1063/1.4721897
- Energypedia. (2015). Lighting Technologies. https://energypedia.info/wiki/Lighting_Technologies
- Wikipedia. (2015). Lighting Technologies. https://en.wikipedia.org/wiki/Luminous_efficacy
- Garret, T. J. (2014). Rebound, Backfire, and the Jevons Paradox. https://www.inscc.utah.edu/~tgarrett/jevons-paradox.html
- Murphy, T. W. (2012). Exponential Economist Meets Finite Pysicist. https://dothemath.ucsd.edu/2012/04/economist-meets-physicist/