8.1Fossil Fuels
We are now ready to dive into the core content of the book: assessing global energy demands and prospects. For most of human history, we derived energy from food-supplied muscle power of people and work animals, burning firewood, and harnessing wind and water flow (all deriving from solar energy). Then a most remarkable thing happened: the discovery and widespread utilization of fossil fuels. The abundance of energy delivered by fossil fuels profoundly changed the human condition, such that many elements of our modern world would seem like magic to someone living 200 or even 100 years ago.
Fossil fuels still completely dominate our energy usage. Every country is reliant on some amount of fossil fuels—especially for transportation. Even though fossil fuels cannot be our future—due to finite resource depletion and climate change concerns—it is critical that we look at these pillars of modern life, assessing what makes them both amazing and terrible, and what we might expect going forward. Facing the stark and underappreciated reality of fossil fuels will sharpen our desire to learn more about what might come after, as subsequent chapters address.
8.28.1 The Most Important Plot Ever
We have so far gained a few big-picture perspectives on the human endeavor. First, we illustrated the absurdity of constant growth in both physical and economic terms, concluding that growth must be confined to a temporary phase and will not be physically allowed to continue indefinitely. Next, we looked at population realities to understand how that story might develop. Then we looked at the scale of the universe, how minuscule Earth is in the vast emptiness, and explored the extreme
Oil pipelines and gas flaring on the Alaskan tundra at Prudhoe Bay. A drill rig fades into the fog at top center. Note the optical illusion that makes the photo’s bottom border look crooked! Photo credit: Tom Murphy
difficulties of colonization—putting the emphasis on managing our challenges right here on Earth.
In order to frame just how important fossil fuels are and have been, we again take a broad view to put our energy trajectory in perspective before getting into the nuts and bolts of fossil fuels. The picture that emerges has the potential to reframe personal perspectives on our future.
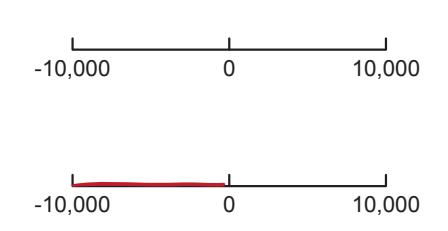
The result may have greater impact if you are an active participant in its creation. So get some paper, the back of an envelope, or something. Draw a horizontal axis as a timeline. Label the left edge as -10,000 years (past). The right edge is +10,000 years (future). The middle is 0 (now; see the example in the margin). The vertical axis represents global energy production, on a linear scale. For ages, this was too tiny to see poking up above the floor. Only about 200 years ago did it become visible. So for the first 98% of the way from -10,000 to 0, draw a line hugging the floor. In the last 200 years, energy usage has increased exponentially.1 So draw a smooth curve connecting the previous line into a steep rise at present (middle of the plot), using much or all of the available vertical space.What emerges is the classic “hockey stick” plot that applies to many physical attributes of our world: population, carbon dioxide, temperature, and—in the present case—energy use. In the long flat portion of the plot, our energy came from firewood and muscle (both animal and human labor). But the sudden transformative rise is really a story of fossil fuels. Even today, having added hydroelectric, nuclear, solar, wind, geothermal, and tidal power to the mix, fossil fuels still account for over 80% of the total.2 2: It’s even worse than it sounds, since 10%
Let us then continue the plot in the context of fossil fuels. Being a finite resource, we know in broad terms what the curve must look like. It must drop back down to zero and ride into the future looking much as it did in the past: at zero. One may debate the exact timing of the peak of fossil fuel use, but for a variety of reasons we would be well justified in placing it sometime this century. We’ll leave it to individual preference if you want to allow the curve to climb a bit more before turning down, but don’t stray too far. This century ends only 1% of the way from 0 to +10,000, so don’t let the peak get very far at all from the middle of the plot. Once turning down, the curve is likely to look reasonably symmetric, returning to zero in short order and staying there.
Independent of individual choices, if keeping within reason we’re all looking at the same basic plot (as in Figure 8.1): fossil fuels are a blip on the time scales we associate with history. We live in a most abnormal time.3 Because the upswing has lasted for generations, it seems entirely normal to most people: it’s the only reality we or any person we’ve ever met has known. Lacking perspective, a child will view their life circumstances as normal, no matter how impoverished or privileged: it’s the only world they’ve ever known or seen. Likewise, we accept and define our current world as normal—even if historical perspective
1: . . . a smooth curve peeling up off the floor and rocketing to an essentially vertical recent trajectory

is still in the form of biomass, much of which is old-technology firewood, leaving only 10% in the more modern forms of hydro, nuclear, solar, wind, geothermal, and tidal.
3: Social scientists are trained to not label their own time as abnormal, as such thinking may reflect a sloppy bias that all people through history might be tempted to adopt. Yet, neither should we declare that abnormal times can never happen. Any quantitative assessment of the current human scale and planetary resource impact argues that we are justified in allowing ourselves an exception for the present age.
ultimately considers the last century or two to be the most insanely unusual period of the human experience—like a fireworks show.
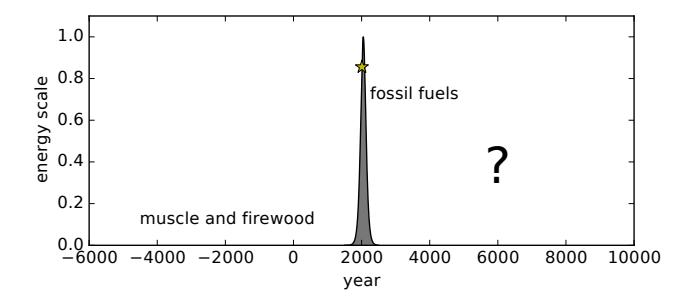
Figure 8.1 should stimulate a swarm of questions. Where are we on the curve? When is the peak? Is the decline phase marked by escalating energy scarcity, or the advent of a renewable energy future? Might the far future look more like the past (muscle and firewood) than the present? Will this plot change how we interpret the world and our own plans for the future? The only fair conclusion is that we really do not know how the future will unfold.4 We can label the left side as “muscle and firewood,” and the spike as fossil fuels, but the only credible occupant of the right-hand side is a gigantic question mark.The idea of Figure 8.1 is not original to this textbook, having been portrayed in various incarnations over the last half-century or so [38] [38]: Hubbert (1962), "Energy resources: . When anyone makes a claim about what they think will happen by late-century, think about this plot. So many of our assumptions are based on the recent but abnormal past. All bets are off in defining the future. In one sense, those who rightly point out that we can’t expect to be clever enough to foresee the future are correct—but perhaps in an unintentionally symmetric way. The future could be far more dismal than our dreams currently project. That would also be a surprise to many. We need to approach the future with humility, and set aside preconceived notions of where things are heading so that we can make choices now that will help define what comes next. Taking it for granted is a risky move.5 Only by acknowledging the potential for a disastrous outcome can we take steps to mitigate that possibility. Waving it off is the most dangerous move we could make.
8.2.0.0.1Box 8.1: Will Renewables Save Us?
Just because fossil fuel energy must return to pre-industrial levels in Figure 8.1 does not dictate that human society must return to pre-industrial energy levels. After all, solar, wind, nuclear, hydroelectricity are available to us now. Yet we will struggle to match today’s energy levels on these resources alone. More disturbing is the notion that we may not be able to maintain high-technology approaches in a world devoid of fossil fuels. No one has demonstrated how, yet. Figure 8.1: Energy over the ages, in the form of fossil fuels. Up until the present, fossil fuels capture the bulk of the human energy story. We know what it must look like in the long term as well. The huge question is how the second half of human history looks, after fossil fuels are depleted or abandoned. The yellow star is a guess as to our current position, based on evidence addressed later in the chapter suggesting that the resources are nearly halfway depleted.
4: We can rule some things out, though, like unending growth and fossil fuels lasting centuries more.
a report to the Committee on Natural Resources of the National Academy of Sciences; National Research Council"
5: In this sense, taking the risk seriously fits the definition of the word “conservative,” even if present political alignments are mislabeled in this regard.
Also, the very disruption of losing such a critical resource without adequate advanced preparation may damage our capabilities. The short answer is: we simply do not know. The question mark in Figure 8.1 is the most fair statement we can make.
Note that Figure 8.1 is not intended to predict a particular future path. But it can serve to to counterbalance the prevailing optimism about a technologically marvelous future by providing a sanity check so that we might acknowledge that we really do not know. How can it be wrong to say that we do not know what the future holds? Yet, accompanying this uncertainty is a glimmer of hope: if the future is so uncertain and unscripted, then perhaps we have the power to write the script and set ourselves onto a viable and pleasant future path. If we elect to do so, it is of paramount importance that we do not ignore limitations imposed by nature in the process.
8.2.18.2 Overview: Coal, Oil, and Gas
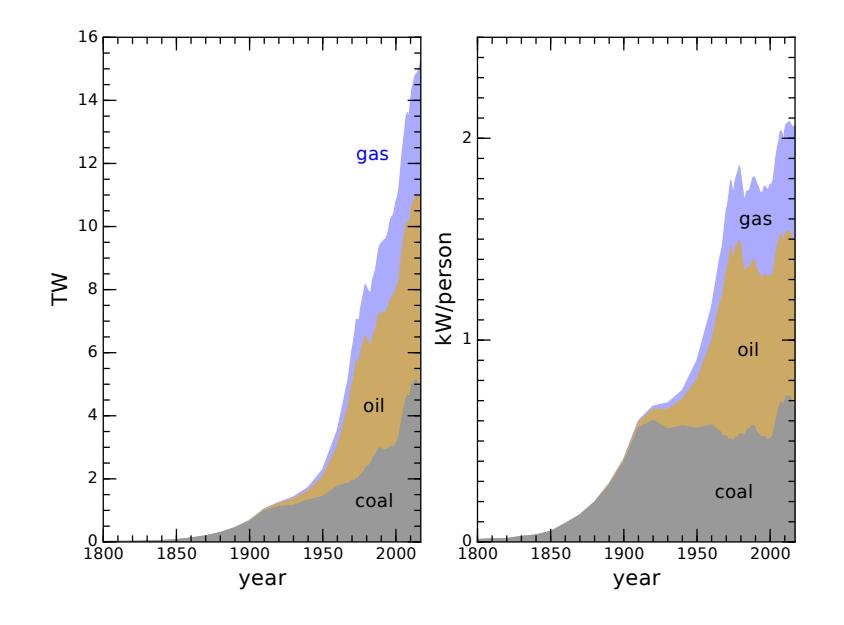
Fossil fuels are found in three principal forms: coal, oil (petroleum), and natural gas.6 They are essentially a form of ancient solar energy that plants once captured and stored as chemical energy to be locked away underground for many millions of years.7 Sporadic, low-level use of fossil fuels dates back millennia, but modern use began in earnest in the eighteenth century with coal in Britain. Figure 8.2 makes clear that the use of coal did not really gather steam until the mid-nineteenth century, when industrialization took off. One may suspect that much of the rise in the use of fossil fuels is simply a reflection of population growth, but this turns out to be wrong. The right-hand side of Figure 8.2 divides the amount of fossil fuel use by global population to show that energy use per capita has also risen steeply over this time period, so that the exponential-looking phenomenon in the left panel is a combination of more people and more use per person. Today, the global average rate of use of fossil fuel use is a little over 2,000 W per person.8 From Figure 8.2, we may say that coal really ramped up starting around 1850, oil around 1915, and natural gas around 1970.9### 8.2.1 Coal
Coal—which looks like black rock—is the remnant of plant matter deposited, turned to peat, and heated/compressed by burial to form a mostly-carbon substance that can be combusted with oxygen to generate heat. The heat can be used to make steam, which can then power machinery or turbines for producing electricity.10 Or the heat may be used directly for materials processing, like creating molten steel in blast furnaces. 10: . . . covered in Chapter 66: Think of the three forms of fossil fuels as solid (coal), liquid (petroleum) and gas (natural gas).
7: It is in this sense that the word “fossil” is appropriate: ancient remnants of life buried underground.
8: 15 TW of fossil fuel use divided by nearly 8 billion people is about 2,000 W per person. Compare to the U.S. total energy appetite of 10,000 W per person.
9: All of these sources were first used much earlier, but at insignificant levels. Natural gas makes a meaningful appearance starting around 1920, but heavy use began 50 years later after pipeline infrastructures were in place.
10: . . . covered in Chapter 6
Coal opened the door on the Industrial Revolution11 in the late eighteenth century, allowing locomotion (trains), mechanized manufacturing, large-scale materials processing, and heating applications. Somewhat circularly, the first major use of the steam engine12 was to pump water out of coal mines to accelerate the extraction of... coal. This fact further highlights that from the very start, the Industrial Revolution was focused on the fossil fuel resource that enabled it.
11: ... which history may rename the Fossil Fuel Revolution
12: The first widely adopted steam engine design is credited to James Watt, from whom we get the name of our unit for power.Today in the U.S., coal accounts for 13% of total energy consumption13—down considerably from 23% in 2000.14 For the world at large, coal still accounts for 25% of primary energy use.15 The vast majority of coal (91%) in the U.S. goes to electricity production, the remainder fueling industrial processes requiring lots of heat. The quality of coal varies greatly. Table 8.1 presents properties of the four main coal categories. Anthracite is the king of coals, but has been largely consumed at this stage. Coal grades having lower energy content contain more non-combustible materials16 like , , , and water.
14: As discussed in Chapter 7, coal’s decline in the U.S. is largely due to increased reliance on natural gas for electricity.
15: Fig. 7.7 (p. 109)
16: . . . sometimes called “ash” content and volatiles
| Grade | Carbon Content (%) | Energy Density (kcal/g) |
|---|---|---|
| Anthracite | 86–97 | 6–8 |
| Bituminous | 45–86 | 5.5–8 |
| Sub-bituminous | 35–45 | 4.5–6.5 |
| Lignite | 25–35 | 2.5–5 |
8.2.1.18.2.2 Petroleum (Oil)
Petroleum—also called oil—is ubiquitous in our world as the source for gasoline, diesel, kerosene, lubricating oils, tar/asphalt, and even most Figure 8.2: Historical use of fossil fuels worldwide, which may be viewed as a zoomin of the left-hand side of the peak in Figure 8.1. The three types are stacked on top of one another, so that gas makes the smallest contribution, not the biggest. On the left is the raw usage rate expressed in terawatts, while the right is a per-capita measure showing that the left-hand rise is much more than just a reflection of population growth [16].
Fuel Revolution
design is credited to James Watt, from whom we get the name of our unit for power.
8.2.1.1.113: Fig. 7.4 (p.107)
cline in the U.S. is largely due to increased reliance on natural gas for electricity.
16: ...sometimes called “ash” content and volatiles
Table 8.1: Four classes for grades of coal, in order of decreasing energy content and value. Anthracite has been largely depleted and is a rare find today. [39, 40]
plastics. Virtually all17 transportation: planes, trains, automobiles, and ships run on petroleum-based energy.Petroleum first entered the modern scene around 1850, and the first drilled well18 was in 1858 in Pennsylvania. Early uses were for kerosene lamps.19 The first commercial internal combustion engine closely followed in 1859, arriving at an essentially modern form in 1876 at the hands of Nikolaus Otto.20 The first production automobile using a gasoline-powered internal combustion engine was developed by Karl Benz in 1885 and Henry Ford’s Model T began mass-production in 1913. In the intervening years, electric cars surprisingly were more popular, but quickly gave way to the gasoline21 car due to superior range, quick refueling, and cost.
18: ... using a steam engine powered by coal
19: ... a relief from expensive and declining whale oil resources
20: Why isn’t it Otto-mobile, then?
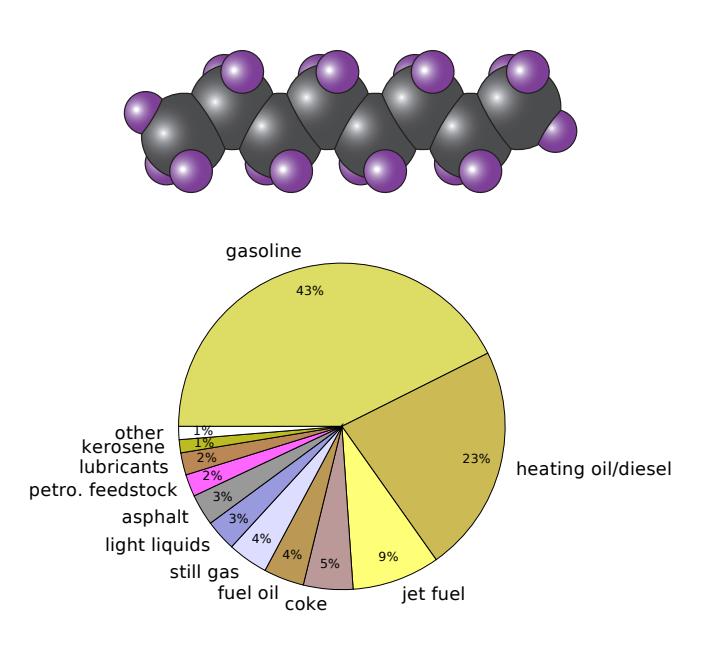
21: For clarity, gasoline is a liquid that derives from petroleum. Natural gas is in gaseous form, not directly related to gasoline.Today, petroleum supplies 37% of energy consumption in the U.S.22 70% of petroleum goes to transportation (92% of transportation energy is in the form of petroleum), while another 24% goes to industrial processes.23 Globally, petroleum usage represents a slightly smaller fraction of total energy than in the U.S., at 31% of total energy consumption.24The petroleum extracted from the ground is often called crude oil, and consists primarily of hydrocarbon chains of various lengths. The lighter molecules (shorter chains)—typified by octane (Figure 8.3)—are useful for gasoline, while the much heavier (longer) molecules are found in tar/asphalt, lubricants, or used as “petrochemical feedstock” for plastics. The process of refinement separates constituents by chain length, producing gasoline, kerosene, diesel, heating oil, lubricants, tar, etc. 92% of crude oil goes to energy production of some form (burned), while 8% is used to create petrochemical products, as depicted in Figure 8.4.
fuels, since > 60% of electricity in the U.S. is fossil-generated.
coal
19: . . . a relief from expensive and declining whale oil resources
20: Why isn’t it Otto-mobile, then?
21: For clarity, gasoline is a liquid that derives from petroleum. Natural gas is in gaseous form, not directly related to gasoline.
22: Recall that Chapter 7 presented these breakdowns in graphical form.
24: Fig. 7.4 (p. 107) and Fig. 7.7 (p. 109)
Figure 8.3: Octane (C8H18, containing 8 carbon atoms and 18 hydrogens) is among the shorter/lighter hydrocarbon chains found in oil, and is typical of gasoline. Longer chains of the same basic design are found in lubricants, tar, and as feedstock for plastics.
Figure 8.4: Fractional use of a barrel of petroleum, from [41]. All but asphalt, petrochemical feedstock, lubricants, and “other” are burned for energy, amounting to 92% burned. Still gases include methane, ethane, propane and butane in gaseous form, while the light liquids are also mostly propane and butane in liquid form. Coke is not the soft drink.
© 2022 T. W. Murphy, Jr.; Creative Commons Attribution-NonCommercial 4.0 International Lic.; Freely available at: https://
Petroleum is measured in barrels (bbl), equating to 159 L (42 gal). Each barrel of crude oil contains about 6.1 GJ of energy (1,700 kWh; 5.8 MBtu). For reference, the world consumes about 30 billion barrels a year (the U.S. is about 7 billion barrels per year, or 20 million barrels per day). No single country produces oil at a rate greater than about 12 million barrels per day.25
To provide some perspective on how special/rare oil is, the chances of finding any by drilling a random spot on the planet is about 0.01%.26 posit thickness of 10 m This is because many geological conditions must be met to make oil:
- Organic material must be deposited in an oxygen-poor environment to inhibit decomposition, like dead animal and plant remnants settling to the bottom of a still, shallow sea;
- The material must not go below about 4 km of rock, or the pressure will “overcrack” the molecules to form natural gas (still useful, if trapped underground);
Oil deposits are rare and tend to be clustered in certain regions of the world where ancient shallow seabeds and geological activity have conspired to sequester organic material and transform it appropriately. The process takes millions of years to complete, and we are depleting the resource about 100,000 times faster than it is being replenished.28 28: A simple way to see this is that it took
Many early oil wells were “gushers”—under enough pressure to push up to the surface under no effort. Modern extraction is not so lucky, having depleted the easy oil already. A combination of techniques is used to push or pull the oil out of its porous rock, including pumps, injecting water under high pressure, bending the drill path to travel horizontally through the deposit, or fracturing29 the underground rock 29: . . . colloquially called fracking via pressurized fluids. More work is required to coax the oil out of the ground as time moves forward.
8.2.28.2.3 Natural Gas
Natural gas is familiar to many as a source of heat in homes (stoves, hot water, furnace), but is also a major contributor to electricity production and industrial processes (usually for direct heat in furnaces/ovens). It is also used extensively in the production of fertilizer via the Haber process.30 30: The Haber process uses the energeti-
Natural gas is primarily methane (CH4). Its formation process is similar to that of oil, but deeper underground where the pressure is higher and 25: As a consequence, the U.S. is presently unable to support its petroleum needs from domestic resources alone.
26: . . . based on a crude calculation of the total resource and assuming a typical de-
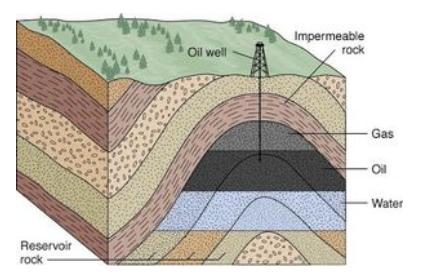
Figure 8.5: Oil and gas embedded in porous rock, under an impermeable caprock [42]. From U. Calgary.
up to 20 million barrels over one million years, which is short on these geological timescales.
tens of millions years to create the resource that we are consuming over the course of a few centuries: a ratio of at least 100,000 (see Box 10.2; p.169). This is like charging a phone for 3 hours and then discharging it in 0.1 seconds! Viva Las Vegas! Fireworks!
29: ...colloquially called fracking
cally cheap hydrogen in methane (CH4) to produce ammonia (NH3) as a chief ingredient in nitrogen-rich fertilizers.
longer-chain hydrocarbons are broken down to single-carbon methane molecules. We find natural gas trapped in underground reservoirs, often on top of oil deposits (Figure 8.5). Thus petroleum drilling operations typically also produce natural gas output.31 31: Unless a gas pipeline is in place at the The gas itself tends to flow out freely once a well is drilled, since it is under great pressure and not viscous like oil. The first commercial use of natural gas started with a well in New York in 1821, leading to a pipeline distribution for street lighting in Philadelphia in 1836. Because of its low density32 compared 32: . . . on account of its being gaseous to coal or petroleum, it is often impractical to collect, store and transport the gas, strongly favoring a pipeline infrastructure for its delivery. Lack of pipeline infrastructure delayed widespread use of natural gas until about 1970. It is also possible to liquefy natural gas (called LNG) by cooling to −160◦C and then storing/transporting in cryogenic vessels.
Natural gas constitutes 31% of energy consumption in the U.S., and 22% globally.33. Because of the need for pipeline infrastructure in order 33: Fig. 7.4 (p.107) and Fig. 7.7 (p.109) to deliver gas to consumers, remote areas are typically unable to take advantage of the resource. The uses for natural gas in the U.S. are more diverse than for coal or oil: 35% goes to electricity production, 34% for industrial purposes, and 29% for residential and commercial heating.34 34: Fig. 7.2 (p.105)
8.38.3 Chemical Energy
Chemical energy is released as heat when combustible materials are ignited in the presence of oxygen. Sec. B.3 (p. 379) in Appendix B provides some background.
Fossil fuels all work the same way, chemically. The three key reactions for coal, methane, and octane35 35: Gasoline—the main product extracted are:
| coal : | C | + | O2 → | CO2 | + 32.8 kJ/g | |
|---|---|---|---|---|---|---|
| gas : | CH4 | + | 2O2 → | CO2 + 2H2O | + 55.6 kJ/g | (8.1) |
| oil : | C8H18 | + | 252 O2 → | 8CO2 + 9H2O | + 48.0 kJ/g |
The energy amounts above represent the total energy available per gram of input fuel.36 36: . . . not counting the oxygen; just the Table 8.2 provides several key attributes of fossil fuel combustion. Energy density, in kJ per gram or often kcal/g, is a fundamentally important measure of the fuel’s potency. By expressing in kcal/g, we can compare to food labels in the U.S., for which fats are around 9 kcal/g, while carbohydrates and proteins clock in around 4 kcal/g.
| Fuel | Representative | molar mass | kJ/mol | kJ/g | kcal/g |
|---|---|---|---|---|---|
| coal | C | 12 | 393.5 | 32.8 | 7.8 |
| natural gas | CH4 | 16 | 890.3 | 55.6 | 13.3 |
| petroleum | C8H18 | 114 | 5,471 | 48.0 | 11.5 |
drill site, the natural gas is too voluminous to be contained/stored, so is often flared (burned; wasted) at the well-head.
32: ...on account of its being gaseous
33: Fig. 7.4 (p. 107) and Fig. 7.7 (p. 109)
34: Fig. 7.2 (p. 105)
from petroleum—is a blend of mediumsized hydrocarbon chains, and we use octane as a decent representative for oil.
carbon-based fuel
Both fossil fuels and food are a type of chemical storage ultimately tracing back to photosynthesis in plants.
Table 8.2: Combustion properties of fossil fuels.
Note that fossil fuels are more like fat (near 10 kcal/g) than carbohydrates (at 4 kcal/g).37
8.3.0.0.1Box 8.2: Superlative Energy Density
To put these energy densities into perspective and demonstrate how amazing fossil fuels are, consider that the explosive TNT38 has an energy density of just 1.0 kcal/g. But comparing to TNT is somewhat unfair, as explosives must carry their oxygen with them.39 Hydrogen gas tops the energy density charts, chemically, at 34 kcal/g, because hydrogen is such a light atom.40 If having to carry the oxygen along, as rockets must, for instance, the hydrogen-plus-oxygen source is down to 3.8 kcal/g. Rocket fuels and explosives, in general, tend to be in this range of a few kcal/g for this reason. Aside from hydrogen, very few compounds outperform methane for energy density. So crudely, 15 kcal/g is about the top of the chemical scale.
38: ... C6H2(NO2)3CH3
39: An explosion is too fast—and violent—to get oxygen from the surrounding air.
40: But hydrogen is both bulky and so highly flammable as to be dangerous to store in gaseous form (look up Hindenburg), so don’t get too excited.# 8.4 Fossil Fuel Pros and Cons
8.3.18.4.1 What Makes Fossil Fuels Amazing
Energy Density: We have seen in Section 8.3 that the energy density of fossil fuels is quite respectable: about the best that chemistry delivers. Anything over 10 kcal/g is a “superfood” energetically. Table 8.3 compares to other substances, by which we see that fossil fuels are two orders-of-magnitude more energy-dense than battery storage.
Safety: Fossil fuels have greater energy density than explosives, without being particularly explosive! The safety aspect of fossil fuels is a big selling point. Sure, gasoline burns, but really it’s the vapor mixed with oxygen that goes poof. If you (foolishly; please don’t do this!) throw a match onto a bowl of gasoline, you’ll certainly get some lively fire, but the thing won’t explode. Only the vapor above the pool will be on fire. Think about how many cars you’ve seen in your life, and how many of those have exploded.41 41: . . . discounting dramatic events the en-How many wrecked cars have you seen, and how many of those exploded? It is not impossible to have an explosive accident from gasoline, but it’s pretty rare.
Cheap: Fossil fuels were bestowed upon us as a byproduct of biological and geological processes on our planet. They are essentially free—at least the way we have historically viewed natural resources as ours to grab. How cheap are they? Hiring a physical laborer to exert 100 W of mechanical power (digging, for instance) for 40 hours a week at $15/hr costs $600 for a week. For that price, we receive 4 kWh of work. In electricity terms, the same 4 kWh costs $0.60 at typical rates (1,000 times cheaper than human labor). Gasoline—for which one gallon contains 37: The simplest way to understand this is that carbohydrates (sugars, such as glucose: C6H12O6) already have oxygen in the molecules, and are in some sense already half-reacted (combusted) with oxygen, as elaborated in Sec. B.3 (p. 379).
C6H2(NO2)3CH3to get oxygen from the surrounding air.
highly flammable as to be dangerous to store in gaseous form (look up Hindenburg), so don’t get too excited.
Table 8.3: Energy densities of familiar energy substances. The Tesla Powerwall represents available lithium-ion capability. Alkaline batteries are familiar AA or AAA cells, and lead-acid batteries are the 12 V ones found in most cars. For hydroelectricity, a 50 m dam is assumed.
| Substance | kcal/g |
|---|---|
| Gasoline | 11 |
| Fat (food) | 9 |
| Carbohydrates | 4 |
| Rocket Fuel | 4 |
| TNT explosive | 1 |
| Alkaline battery | 0.11 |
| Tesla Powerwall | 0.10 |
| Lead-acid battery | 0.03 |
| Hydroelectric (50 m) | 0.0001 |
tertainment industry prepares for us
37 kWh and costs $4—would be just $0.43. Efficiency differences, and the cost of the machine to perform the labor also factor in. But the point should be clear enough.
Perfect Storage: Effectively, fossil fuels represent a form of long-term storage of ancient sunlight, captured in plant matter and (sometimes via animal ingestion) ending up buried underground as chemical energy. Compared to other forms of storage, like rechargeable batteries, flywheels, or even hydroelectric reservoirs (pumped storage), fossil fuels are astoundingly superior. Fossil fuel deposits are tens or hundreds of millions of years old. Try finding a battery that will hold its charge that long! Seemingly permanent man-made dams/reservoirs are unlikely to last even one-thousandth as long. Combined with their superior energy density, fossil fuels are perhaps the best form of energy storage available to us, aside from nuclear materials.
Food Production: The Green Revolution in agriculture would not have been possible without fossil fuels. Not only did they provide the motive force for mechanized farming (plowing larger tracts of land, harvesting and processing crops quickly), but the all-important fertilizer is derived from natural gas.42 42: Methane (CH4) provides an energeti-
Technology Catalyst: Fossil fuels opened the door to widespread mechanization and electrification, completely transforming our way of life. As central as their role has been, it is difficult to claim that many of the benefits we enjoy today—whether health care, technology, scientific knowledge, or comfortable living standards—would have been possible without them. Much that we celebrate in this world rode on the back of fossil fuels.
8.3.28.4.2 What Makes Fossil Fuels Terrible
Climate Change: Nothing comes for free. Fossil fuels also bring many downsides. Chief on many peoples’ minds today is climate change, via CO2 emission—an unavoidable consequence of combustion (Eq. 8.1). Extracting energy from fossil fuels,43 leaves no choice but to accept CO 43: . . . that’s the whole point 2 as a byproduct, in large quantities. We will get to the details of climate change in Chapter 9, but for now will just say that increased CO2 in the atmosphere changes the equilibrium temperature of Earth by altering how effectively the surface can radiate heat away to space through the atmosphere. The physical mechanism is very well understood, and the amount of CO2 that fossil fuel combustion has produced is more than enough to account for the measured CO2 increase in our atmosphere. What is less certain is how the complex, nonlinear, interconnected climate systems will react, and whether positive feedbacks that exacerbate the problem dominate44 over negative feedbacks that act to tame the 44: All evidence says positive dominates. consequences. In the meantime, fossil fuels have handed us a global-scale
cally favorable source of hydrogen to make ammonia (NH3) as a way to deliver nitrogen to plants (called the Haber process). Water (H2O) may seem like a more obvious and abundant source for hydrogen, but in this case substantial energy would have to be injected to extract hydrogen. Methane, by contrast, will give up its hydrogen more easily.
43: . . . that’s the whole point
44: All evidence says positive dominates.
problem of uncertain magnitude and may end up costing us—and other species—dearly.
Population Enabler: Human population pressures on our planet may also be traced to fossil fuels via agricultural mechanization and fertilizer feedstock (the Green Revolution). Since so many new global challenges deforestation, fisheries collapse, species loss, climate change—scale with the population, perhaps all of these ills can be attributed to fossil fuels in that it is doubtful these problems would exist at the present scale had we never discovered or utilized them.
Military Conflict: Fossil fuels represent such a prize that access and control of the resources has played a key role in many armed conflicts. Put another way, how many have lost their lives to fights over these precious resources? It is hard to view the complex and fraught relationships in the middle-east as being disconnected from the fact that it is the most oil-rich region in the world.45 45: Countries and regions lacking impor-
Environmental Toll: Environmental effects from the extraction of fossil fuels can be pretty destructive. We have seen oil tankers crash and coat beaches and wildlife in tarry sludge. The Deepwater Horizon drill platform failure in 2010 spewed vast amounts of oil into the ocean. Coal extraction can leave mountaintops bare and contaminate local water sources from the tailings. Hydraulic fracturing (fracking) can contaminate groundwater supplies. Natural gas wells—including fracking sites—often leak methane into the atmosphere, which is 80 times more potent than CO2 as a greenhouse gas46 on short timescales. the developed world. 46: Although, methane does not last in theSubstance Addiction: Finally, the very fact that fossil fuels are finite may be viewed as a serious negative. Granted, an effectively inexhaustible supply would be devastating for the climate change story. Setting that aside, the fossil fuel inheritance might be viewed as a sort of bait-and-switch trick. We have built up to our current state wholly in the context of cheap and available fossil fuels, and simply do not know if we can continue to live at a similar standard in a post-fossil world. Fossil fuels have lasted long enough (several generations) to seem normal. We take them for granted, and have not formulated a master plan for a viable world devoid of these critical resources. How will air travel, ships, trains, and long-haul trucking47 be handled without petroleum? The current situation is precarious. Failure to plan wisely for a post-fossil world would not be the fault of fossil fuels by themselves. But the fossil fuel endowment that happened to grace our planet was large enough to harm the climate and to lull us into complacency. Had it been a much smaller amount, we would be less likely to fall into the trap.48 This is the “rabbit out of a hat” referred to in Chapter 2: just getting one conditions us to expect an eternal state of rabbits.
47: All of these modes of transportation are difficult to accomplish via electric drive (Sec. D.3; p. 397), and critical to our global supply chains for manufacture of consumer goods.
48: By the same token, it is unlikely that we would be at a comparable technological level if our inheritance had been much smaller.tant resources receive far less attention from
atmosphere as long as CO2. Still, this is why gas is often flared (burned) at drill sites lacking pipeline infrastructure, rather than allowing it to escape as methane.
are difficult to accomplish via electric drive (Sec. D.3; p. 397), and critical to our global supply chains for manufacture of consumer goods.
we would be at a comparable technological level if our inheritance had been much smaller.
8.3.2.18.4.3 On Balance?
Deciding whether fossil fuels have had a net-positive or net-negative influence on humanity may not be answerable (Table 8.4 provides a summary of the previous two subsections). How many lives has it saved through better technology and health care? How many lives has it destroyed through conflict, pollution, and transportation accidents? How many lives has it created, through vast increases in agricultural productivity—as well as via better medical care? How many species has it destroyed, by promoting habitat loss both directly via extraction and indirectly as a catalyst to population growth via increased agricultural productivity? Sometimes it is even hard to decide which category to put these impacts into. For instance, in the fullness of time, will we see all the lives created on the back of fossil fuels as a good thing? If the result is overshoot, collapse, and the unprecedented suffering of billions of people, then perhaps not. It’s a mess.
In essence, humanity is running this global-scale unauthorized experiment on the planet without a plan. Nothing like this has ever happened, so we don’t know how it will turn out. We have plenty of evidence that past civilizations overextend and collapsed [43] [43]: Diamond (2005), Collapse: How , but we can’t identify a fitting analog to successful navigation of the fossil fuel phenomenon. Meanwhile, plenty of signs justify grave concern.
8.48.5 The Future of Fossil Fuels
8.4.18.5.1 Scenarios
Figure 8.1 provocatively asserts that fossil fuel use must fall back to essentially zero in a relatively short time (within a century or two). This fact alone does not define our future on the spectrum of dismal to glorious, but it is one we need to consider carefully given the fundamentally important role fossil fuels have played in getting us to where we are today. The return to zero fossil fuels could take a variety of forms: These are not strictly exclusive of each other,
- We discover a new form of cheap energy not yet known or appreciated that is a game changer, quickly abandoning the fossil fuels still left in the ground.
- Known renewable energy sources (solar, wind) are developed to the point of being effectively superior to fossil fuels so that market forces naturally move us away from fossil fuels before actually running out.
- Climate change concerns result in politically enforced financial dis-incentives to using fossil fuels, so that we migrate away—albeit likely at higher cost, politically controversial, and not globally adopted.
Table 8.4: Pros and cons of fossil fuels.
| Pro | Con |
|---|---|
| energy dense | climate change |
| safe | overpopulation |
| inexpensive | agent of war |
| long storage | environ. damage |
| agriculture | overdependency |
| technology | so yesterday |
Societies Choose to Fail or Succeed
so some combinations are also possible.
- Increased difficulty in extracting fossil fuels drives their price up so that the market is ultimately forced to accept less convenient and more expensive forms of energy.
- We fail to find suitable substitutes to this precious and unique resource, so that global geopolitics increasingly center on competition for remaining fuel, likely touching off destructive resource wars.
- Perhaps together with the previous point, society slowly grinds to a less energy-rich state, diminishing agricultural capacity and decreasing both the number and standard of living of people on the planet.
We cannot predict which of these paths might manifest, but it is not hard to find adherents to any of these narratives. Part III of this book covers alternatives to fossil fuels, and Chapter 17 summarizes practical challenges to the various alternatives. One lesson that emerges is that fossil fuels beat out alternatives on a host of considerations, leaving a gap between the two groups. If not for the finite supply and climate ills, we would have no incentive to adopt otherwise inferior sources of energy at higher cost. But first, we should briefly look into future prospects for extraction of fossil fuels. How limiting is the physical resource?
8.4.1.18.5.2 Timescales
The simplest approach to evaluating a timescale for resource availability is the R/P ratio: reserves to production.49 49: Here, “production” means "obtaining The idea is very intuitive: if you have $10,000 in a bank account, and tend to spend $1,000 per month on living expenses, you can predict that—absent additional income—you will be able to go for ten months. So if we have an estimate for resource remaining in the ground, and the current rate of use, we simply divide to get a timescale.
Table 8.5 reports the proven reserves in the world and in the U.S. for the three fossil fuels, the estimated fraction used so far globally, the rate of consumption,50 and the timescale given by the R/P ratio essentially identical: no stockpiling.
| Region | Resource | Remaining | % Used | Annual Use | R/P (years) |
|---|---|---|---|---|---|
| World | oil | 1,700 Gbbl | ~45% | 30 Gbbl | ~60 |
| gas | 200 Tcm | ~33% | 3.5 Tcm | ~60 | |
| coal | 900 Gt | ~30% | 8 Gt | ~110 | |
| U.S. | oil | 35 Gbbl | 7 Gbbl | ~5 | |
| gas | 8.5 Tcm | 0.85 Tcm | ~10 | ||
| coal | 250 Gt | 0.7 Gt | ~360 |
The world has already consumed 1.5 trillion barrels of oil, which is nearly the same amount as the 1.7 trillion barrels of proven reserves—indicating that we are roughly halfway through the resource.51 Certainly, we can expect that additional resources will be discovered and added to the
51: This fact is one justification for believing we may be near the top of the symmetric curve in Figure 8.1.from the ground," not fabricating artificially.
50: Consumption and production are es-
Table 8.5: Summary of proven reserves, usage rates, and time remaining for the world and for the U.S. (if using only its domestic supply) [44–46]. Oil is measured in giga-barrels (Gbbl; 109 bbl), gas in teracubic-meters (Tcm; 1012 m3 ), and coal in gigatons (Gt; 1012 kg; noting that 1 ton is 1,000 kg).
we may be near the top of the symmetric curve in Figure 8.1.
proven reserves,52 but the globe is pretty well explored now, and we would not expect huge surprises like another hidden middle-east-size oil deposit. Note that for natural gas, the estimated total resource in the U.S. (what we think we may yet find beyond proven reserves) is about 55 Tcm, which would last just over 60 years.53It is difficult to compare the remaining resource in the three forms directly, since different units are used for each. But we can cast each in terms of energy units for comparison. Doing so, the global reserves of oil, gas, and coal correspond to 10, 8, and 20 ZJ54 remaining, respectively. We have so far consumed 8, 4, and 8 ZJ of oil, gas, and coal (Table 8.6). These form the basis of the estimated fraction consumed in Table 8.5. Note that the amount of oil and gas remaining are roughly comparable in energy, while coal is roughly twice as much.
Coal55 therefore seems to be our most abundant fossil fuel, which prompts two comments. The first is that it is the worst offender in terms of CO2 emission, emitting roughly twice as much CO2 per unit of delivered energy as the other fossil fuels (covered in Chapter 9). The second is a caution in trusting the reserves estimates for coal, having often been vastly overestimated and then reduced significantly. For instance, Britain had to downward-revise their estimated coal reserves over the period from 1970–2000 to about 1% of their original because most of the estimated resource turned out to be in seams too thin and difficult to be commercially viable [47]: Rutledge (2011), "Estimating long-term .For some, the R/P numbers in Table 8.5 may seem alarmingly short, while for others they may signal a comfortable amount of time to devise alternative energy strategies. Either way, this century is critical. But it is also important to recognize that the story is not quite as simple as the R/P ratio. While it provides a useful scale,56 we should consider these nuances:
56: If the number worked out to 5 years,- 1. The production (thus consumption) rate is not steady, but on the whole has grown over time (continued growth would shorten timescale).
- New exploration and discovery adds to reserves (lengthening the timescale), but with diminishing success lately.
- Advances in oil extraction technologies increase the amount of accessible oil (lengthening timescale).
- 4. Geological challenges limit the rate of production (lengthening timescale but also limiting resource availability).
- Demand (thus production) could plummet if superior substitutes are found.
Point number 4 deserves some elaboration. We should not think of fossil fuel reserves as a bank account A car’s gas tank is another tempting, but from which we may withdraw funds at an arbitrary rate, or as a cavernous underground lake just waiting to be slurped out by whatever straw we wish to shove in. Coal, firstly, does not flow, requiring substantial physical effort to expose and remove. The
previously impractical resources available, adding to reserves.
typically delivered by pipelines, domestic supply is more relevant for gas than it is for the globally-traded oil resource.
54: ZJ is zetta-Joules, or 1021 J.
Table 8.6: Proven reserves and amount used, in energy terms.
| Fuel | Proven 1021 J | Used 1021 J |
|---|---|---|
| Coal | 20 | 8 |
| Oil | 10 | 8 |
| Gas | 8 | 4 |
55: Coal reserves estimates [46] are broken into higher-quality anthracite and bituminous (∼7 kcal/g), then sub-bituminous and lignite (∼4.5 kcal/g) varieties, totaling 480 Gt (gigatons) and 430 Gt, respectively. (see Table 8.1).world coal production with logit and probit transforms"
we would be in a panic. If it worked out to 5,000 years, climate change would loom as the chief concern.
flawed mental model. Getting water out of wet sand is closer to the truth for oil extraction.
rate at which it can be removed depends on the thickness of the seam, how deep it is located, and how hard it is to dig out surrounding rock. Even oil is not in some sloshing reservoir, but permeates porous rock, limiting how quickly the viscous fluid can be coaxed to flow out of the rock and into the pump tube. Gas is the quickest to escape its rocky tomb, but at this stage the U.S. has moved to “tight gas” that does not so easily break free—forcing a technique of fracking the rock to open channels for gas to flow. The same technique is being used to access “tight oil” that otherwise refuses to be pumped out of the ground by conventional means.
In all cases, it is obvious that we would pursue the easiest resources first: the low-hanging fruit. As time marches on, we are forced to the more difficult resources.57 Adding to the geological factors is the simple fact that we do not possess unlimited extraction machinery, limiting the rate at which fossil fuels can be delivered from the ground. It is also worth pointing out that drilling deeper will not continue to pay dividends, as Section 8.2.2 points out that oil buried too deep will be “cracked” into gas. 57: . . . deeper underground, under deep water, or in “tight” formationsFigure 8.6 illustrates three variants of possible trajectories for a finite resource. The left-most panel corresponds to the R/P ratio: how long can we go at today’s rate of use, if we locked in consumption at a steady value? The second assumes we continue an upward trajectory, which shortens the time compared to the R/P ratio before the resource runs out (using it ever-faster). Both of these are unrealistic in their own ways—the second one because of the physical constraints on extraction listed above (not a free-flowing resource). The third case is more realistic: a peak and somewhat symmetric decline. This is how real fossil fuel resources behave in practice. All three scenarios could create shocks to the system, but note that the (realistic) peak scenario brings the trauma of declining supplies soonest—long before the R/P ratio would suggest.
8.4.1.28.5.3 Clues in the Data
Despite the uncertainties listed above, we can say for sure that Earth is endowed with a finite supply of fossil fuels, and that in order to consume the resource, deposits must first be discovered via exploration and then developed into active wells. Even in areas known to have oil,58 only 58: . . . also applies to gas about one in ten exploratory wells bears fruit. The chances of striking oil at a random location59 59: Think about throwing a dart at the on Earth is in the neighborhood of 0.01%. Section 8.2.2 indicated the chain of events that must transpire to produce oil.
A plot of the discovery history of conventional oil is revealing, seen in Figure 8.7. In it, we see that discovery peaked over 50 years ago. Since we can’t extract oil we have not yet discovered—much like we can’t possess an iPhone model that hasn’t even been designed yet, the area under the consumption (red) curve must ultimately be no larger than water, or in “tight” formations

Figure 8.6: Three scenarios for a finite resource playing out, all based on the same initial history (the red dot is “now”) and the same remaining amount (blue-shaded region). The red bar over each represents the remaining time until resource decline. See text for details.
58: ... also applies to gas
globe.
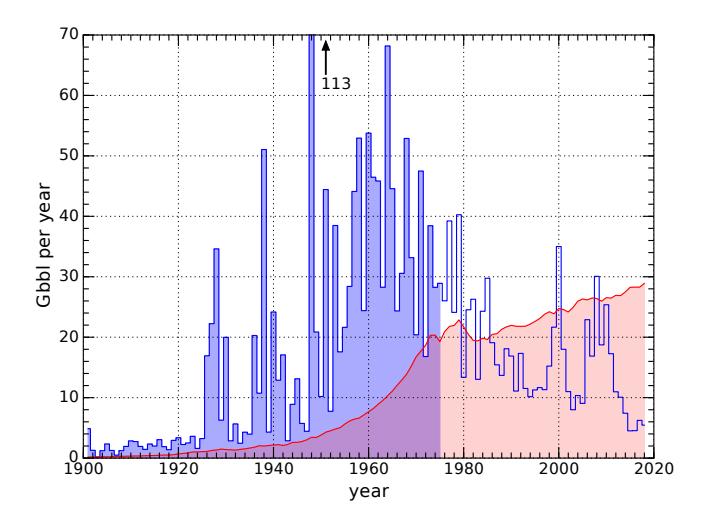
the area under the discovery data (blue). It is therefore inevitable that consumption will peak and fall at some point, by whatever means. Note that a symmetric curve peaks when the resource is half-consumed.
The information in Figure 8.7 can also be re-cast to ask how many years remain in the resource. For any given year, the total remaining resource can be assessed as the cumulative amount discovered to date minus the cumulative amount consumed. Then dividing by that year’s annual production (same as consumption) rate produces an estimate of remaining time (the R/P ratio again). Figure 8.8 shows the result.
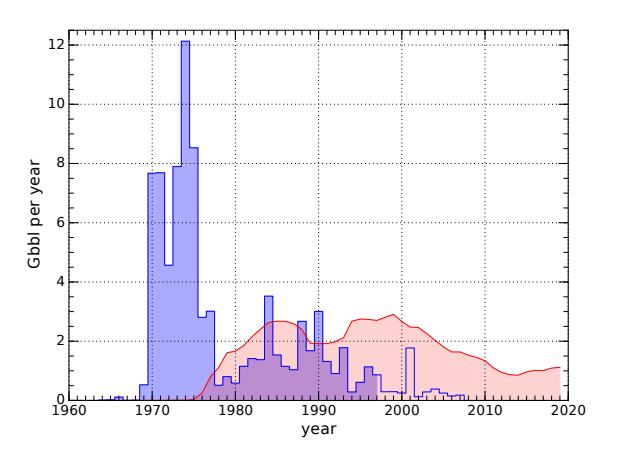
We have seen this story play out numerous times within oil-producing regions. Discovery of oil in the North Sea put the U.K. into the oil business about 50 years ago (Figure 8.9). At first, the discovery rate was brisk, followed by 20 years of modest discovery. It appears that nothing is left to find, as discoveries have stopped. The production shows a double-peak structure—maybe echoing the discovery lull around 1980 but in any case is nearing the end of extraction. Only about 6% of the discovered oil (effectively that discovered after 1996; unshaded in Figure 8.9) is left: not much remains to pump out.
© 2022 T. W. Murphy, Jr.; Creative Commons Attribution-NonCommercial 4.0 International Lic.; Freely available at: https://
Figure 8.7: Historical discovery rate of conventional oil (blue), measured in billion barrels (Gbbl) discovered each year [48]. The red curve shows annual global consumption of conventional crude oil. Until about 1985, we tended to discover more oil than we used each year, but the rate of discovery peaked decades ago and is now in decline as we complete the job of exploring Earth’s resources. The blue area is made equal to area under the red curve, which itself represents the amount of oil used to date. This effectively means that we have used all the oil discovered up to 1976, and are now left with a dwindling bank account (oil reserve)—our annual income (new discovery) being less than our spending (consumption).
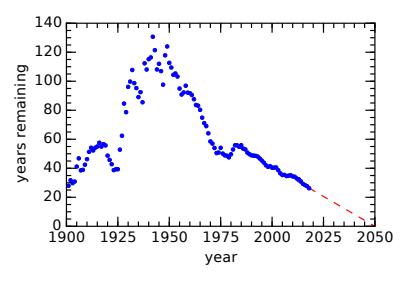
Figure 8.8: Years remaining in the global conventional oil resource as a function of time, extracted from the data in Figure 8.7. Since 1982, the world has been on a steady path toward depletion of the conventional oil resource by 2050.
Figure 8.9: North Sea (U.K.) oil discoveries (blue, in giga-barrels per year) peaked in the 1970s and have basically ended. Production (red) lags discovery, and cannot carry on much longer as the last of the discovered oil (unshaded blue outline) is extracted. Plot conventions follow those in Figure 8.7.
The U.S. experienced a similar history (Figure 8.10) in that discovery of conventional oil peaked around 1950, and production peaked two decades later, around 1970. Nobody wanted this to happen, although some oil geologists (notably M. King Hubbert) pointed out its inevitability based on the preceding discovery peak and simple logic.60 The U.S. had been the largest oil producer since the dawn of the oil age, and was now slipping.61 The peak and subsequent fall caused great anxiety and stimulated tremendous effort to find and develop additional oil resources, leading to the discovery of oil at Prudhoe Bay in Alaska—responsible for the second (lower) peak in the mid 80s. But then the decline resumed for another couple of decades, to the chagrin of many.62
61: This is a large factor in the prosperity 62: To reiterate a key point: it wasn’t for
60: Still, the prevailing attitude was one of The U.S. had denial, until it actually happened.
of the U.S.: it was the “Saudi Arabia” of the first half of the 20th century, leading oil exports and expansion of automotive transportation.
lack of will or effort.
Figure 8.10: U.S. oil production history (blue; from [49]) and consumption history (red; from [34]), in both million barrels per day (left axis) and billion barrels per year (right). The conventional production peak is visible around 1970, a second peak around 1985 from Prudhoe Bay in Alaska, and finally a dramatic upturn due to hydraulic fracturing practices in the last decade. The gap between blue and red curves is made up by imports. The downturn in fracking production in 2020 coincides with the COVID pandemic, so it is not clear whether U.S. oil production will resume the climb or if we are past the peak.
tale to those who might attempt confident predictions of the future. The “fracking” boom opened access to “tight” oil deposits that were previously untenable for conventional drilling. The history is shown in Figure 8.10.
How long will the fracking boom last? One aspect to appreciate is that conventional wells take something like a decade to fully “develop,”63 and even after individually peaking continue to deliver at diminishing rates for many years. Notice the approximate symmetry of the curve64 in Figure 8.10 and its slow decline phase prior to 2010. Fracking “plays”65 are fast: once the small region has been fractured and pumped, the whole process can be over in a matter of a few years. Thus it is certainly possible that the fracking boom on the right-hand-side of Figure 8.10 will end as abruptly as it started—the easy plays being exploited first, leaving less productive fields to round out the declining phase of this boom. In any case, declaring the current state of oil production in the U.S. to represent a “new normal” seems premature.
63: By develop, we mean populate the deposit with multiple drill sites and pumps.
64: Note that the curve is an aggregation of many hundreds of individual wells whose individual production rates rise and fall on shorter time scales.
65: . . . the term for a field to be exploited
8.4.1.38.5.4 Geopolitics
Another wrinkle worth mentioning is the geopolitical angle. Much of the world’s proven reserves are not owned by the countries having the highest oil consumption. Figure 8.11 shows which countries hold the largest stocks, with a caveat that the deposits in Venezuela and Canada are heavy oils,66 which are harder to extract and refine into lighter forms like gasoline, making the middle-east (Saudi Arabia, Iran, Iraq, UAE, and Kuwait) the “real” leaders of light67 crude oil dominated by the more useful shorter-chain hydrocarbon molecules like octane (Figure 8.3). One thing that should cause Americans alarm is to go around the circle looking for close allies. Aside from Canada, with its inconvenient heavy-oil, the picture is not terribly reassuring. Proven reserves of oil in the U.S. amount to 35 billion barrels. At a consumption rate of 20 million barrels per day, the math suggests only 5 years, if we only used our own supply. The proven reserve, however, is a conservative number, often short of estimated total resource: exploration can add to proven reserves. The estimated resource in the U.S. is closer to 200 Gbbl, which would last a little less than 30 years without imports at the present rate of consumption. These short timescales offer some relief for climate change concerns, but perhaps represent bad news for global economies utterly dependent on fossil fuels.
66: ... e.g., tar sands; long-chain hydrocar-bons
67: ... sometimes called “sweet”
57: . . . sometimes called “sweet”
Figure 8.11: Distribution of proven oil reserves by country, on left, according to the U.S. Energy Information Administration. The oil in Venezuela and Canada is heavy oil, harder to extract and process than the light oil characteristic of the middle-east. At right is the oil consumption by country for the top ten consumers (U.S. EIA). Note that the U.S. possesses 2% of the oil, but consumes about 20% of annual production, and an overall lack of correlation between who has oil and who needs it.
Because the rate of extraction can be a limiting factor, it often happens that the rate of production begins to slow down (peaks) around the time half the resource has been exhausted,68 producing a symmetric 68: . . . about where we appear to be on oil usage curve over time. This suggests that the peak can occur well before the timescales resulting from the R/P ratio, as depicted in Figure 8.6. Once the world passes the peak rate of oil production, a sequence of panic-driven damaging events could ensue, making it more difficult (less likely) for us to embark on a renewable-centered post-fossil world. Boxes Box 8.3 and Box 8.4 paint scenarios that cause concern.
68: . . . about where we appear to be on oil
8.4.1.3.1Box 8.3: Resource War
Imagine the scenario in which oil prices climb from their current $50/bbl to $100/bbl.69 69: Oil has been as high as about $160/bbl, Some major oil-producing country—seeing the writing on the wall that this precious resource is only going to become more valuable as supplies inevitably diminish—will decide that its economy was doing just fine at $50/bbl, so can sell half as much at $100/bbl and have the same income. Removing that oil from the market pushes oil prices up further to $150/bbl, at which point other countries may begin playing the same game, but now selling a third as much oil for the same income. The resulting domino effect will cause international crisis, and some military power, acting as the world’s police,70 70: This hypothetical country may also will step in to ensure continued flow of this vital global resource. Other countries possessing military strength will object to this one country’s presumption and control of important segments of the global oil supply, and might potentially engage in a resource war. Sadly, this turn of events would consume massive amounts of energy and other resources to destructive ends, rather than channel these resources into constructive activities like building a post-fossil renewable energy infrastructure.
8.4.1.3.2Box 8.4: The Energy Trap
If we find ourselves in a state of annual decline in energy resources—having clung too tightly to fossil fuels as a cheap and largely superior energy resource—we will have a hard time politically pulling out of the dive, because to do so means transitioning away from fossil fuels via a renewable infrastructure. But such an enormous enterprise will require substantial energy investment. And energy is the very thing in short supply. To embark on this transition, the society would have to voluntarily sacrifice even more than they already are in the energy decline crisis by diverting energy toward the decades-long initiative. The temptation to vote for a politician who would end the program and bring instant energy relief in the short term may be overwhelming. In other words, we could find ourselves in an energy trap. Witness the difficulty the world is having weaning itself off of fossil fuels despite obvious perils in the form of climate change. If it were easy, cheap, and superior to move to renewables, it would have already happened in a heartbeat. Maybe we’re stuck on the flypaper. This notion is further explored in Sec. 18.3 (p. 310).# 8.6 Upshot: Amazing, Terrible, and Limited
History may very well view this time period as the Fossil Fuel Age rather than the Industrial Age. Fossil fuels are a ubiquitous and defining characteristic of this unusual time. The current level of technology, in June 2008 (inflation-adjusted for 2020). A compelling argument can be made that the stress of high oil prices on many sectors of our economy provided a trigger for the financial crisis—putting an end to the growth-fueled bubble in the sub-prime housing market.
have built numerous military bases in the middle-east, in anticipation of this day.
(p. 310).
global population, or impressive state of knowledge would not have been possible without fossil fuels. We therefore owe a great debt of gratitude to these three amazing resources. Perhaps the first species on any planet to discover and use fossil fuels71 71: It is plausible that fossil fuels would be will follow a similar madcap trajectory and even temporarily poke into space, as we have.
Yet fossil fuels bring a number of downsides, like climate change, potential population overshoot (and associated myriad pressures on the planet), pollution and environmental damage. More subtly, a nearcomplete dependence on fossil fuels has transformed human expectations in a way that could result in failure to adapt once they are no longer available. Superior substitutes are not guaranteed, and inferior replacements may not be gracefully adopted.
One thing we know for sure about fossil fuels is that the supply is finite. We are arguably approaching the halfway point72 72: . . . especially in the hardest-to-replace in extraction, and have naturally harvested the easiest deposits of the resources. As extraction gets harder, supply-rate (relative to demand) may become the limiting factor well before the R/P ratio says we will “run out” (see Box 8.5). Recall that fossil fuels are not situated in the equivalent of a single bank account permitting withdrawals of arbitrary size and speed.
8.4.1.3.3Box 8.5: Running Out One Day?
Fossil fuels will not abruptly run out one day, or even one year (see Figure 8.6). Production will taper off slowly over decades as ever-smaller deposits are harder to access and extract. In this sense, “running out” of fossil fuels will not be a sudden, jarring event in human history that sends us into a panicked chaos. Nonetheless, passing the peak and having less available with each passing year creates its own set of hardships. In the best scenario, alternatives ramp up fast enough to offset declining fossil fuel supplies. But the challenge is enormous, and success is far from guaranteed.
Given the important role the diminishing fossil resource plays in our world, today’s insignificant contribution from renewable sources—as presented in Chapter 7—is all the more worrisome. This fate has been apparent to many for at least 50 years, but fossil fuel use has only continued to increase, while growth of alternatives has been lackluster. Part of the reason has to do with the low cost and amazing convenience of fossil fuels compared to alternatives.73 Another part is lack of awareness. Sometimes old—yet no less important—stories have trouble maintaining currency in our news-oriented society.### Box 8.6: Why Not Raise the Price?
If continued reliance on fossil fuels is risky—both from resource
a common result of billions of years of evolution, resulting from buried biological matter on planets supporting rich ecosystems— Earth being the only one we know about (see Sec. 18.4; p. 312).
oil resource
not raised to discourage fossil fuel use and catalyze development of alternatives. See Box 8.6.
scarcity and climate change points of view—then why do prices remain low, serving to encourage continued use and hinder adoption of alternatives? Why doesn’t the government raise the price?
The rookie mistake here is assuming that adults are in charge. Markets are in charge. Governments may impose taxes and tariffs, but cannot go overboard before voters74 object. Global competition without 74: . . . in democracies, anyway global government penalizes those countries self-imposing additional costs on their citizens. And finally, short-term sacrifice for longterm benefit is not a human strong suit—especially in the face of uncertainty. Convincing people of a future problem that has never surfaced for generation after generation turns out to be hard.
8.4.28.7 Problems
- Make a zoom-in75 75: Figure 8.2 is at least a good example of of Figure 8.1 showing the central fossil fuel spike. You could have it “leave the floor” around 1850, reach a peak maybe at 2050 (fine for the purposes of this problem), and return to zero in symmetric fashion. Now draw—perhaps using a different color—the part of the curve you’ve lived through, and project out using a dotted line the part of the curve you think you’ll live through (over the peak?). Now draw a segment representing your parents,76 76: . . . or something representative of their and do the same for your grandparents and great generation grandparents. You’ll end up with overlapping lines.77 Don’t worry about exact dates; we’re just looking for a visual impression. Has anybody you’ve ever met known any period but the rapid growth phase in energy you’ve experienced in your life?
- If you had to fill in the big question mark in Figure 8.1 with a prediction of the scenario you think is most likely to result in a few thousand years, what would you say? How do you think humans will live?78 78: E.g., what energy sources, primitive vs. technological, dwelling style, etc. This is really an exercise to make us think about possibilities: no one knows the “right” answer.
74: ...in democracies, anyway
the left-hand side of the spike.
76: . . .or something representative of their generation
77: Just stack them a bit so you can tell them apart.
78: E.g., what energy sources, primitive vs. technological, dwelling style, etc.
global fossil fuel use (total, not per-capita) during the last 20 years.
- The U.S. uses approximately 20 million barrels of oil per day, and has a population of about 330 million people. On average, then, how many barrels per year is one person responsible for consuming?79
- If an average American is responsible for consuming a barrel80 of 80: A barrel contains about 6.1 GJ of energy. oil every 18 days, what power does this correspond to, in Watts?
- Using the values in Table 8.2, compute the energy content of a gallon of gasoline assuming that octane (C8H18) is a good representative, energetically. Express your answer in both MJ and kWh. One gallon is 3.785 L and in the case of gasoline has a mass of 2.8 kg.81 81: The density of gasoline is about 0.75
- Every day, Americans use about 9 × 10⁸ J of energy per person. Since we know that 37%, 13%, and 31% of this comes from oil, coal, and gas, respectively, use Table 8.2 to figure out how much mass of each is used per day on American’s behalfs, and take a moment to compare to equivalent-mass volumes of water to provide familiar context.
- What if we could get our energy from drinking gasoline?82 ring to Table 8.2, how many grams of gasoline83 would we have to drink daily to satisfy the typical 2,000 kcal/day diet? How much volume does this represent if gasoline is 0.75 g/mL? Relate this to a familiar container for holding liquids.84 84: For reference, 100 mL is 3.4 oz.
- One liter of gasoline (1,000 mL) has a mass of about 750 g and contains about 9.7 kWh of energy. Meanwhile, a typical AA battery
i This problem has much in common with Prob. 3 (p.111) in Chapter 7.
79: Even if not personally consuming this much, it is used on behalf of individuals to provide goods and services for them.
- A barrel contains about 6.1 GJ of energy.
times that of water.
82: Don’t do this! It won’t work! Refer-83: . . . represented by octane, C8H18
84: For reference, 100 mL is 3.4 oz.
occupies 7.4 mL of volume at a mass of 23 g, while holding about 0.003 kWh of energy. How much volume and how heavy would a collection of AA batteries be in order to match the energy in a liter of gasoline, and by what factors (in volume and mass) is gasoline superior?
- A gallon of gasoline contains about 37 kWh of energy and costs about $4, while a typical AA battery holds about 0.003 kWh and costs about $0.50 each, in bulk. By what factor are batteries more expensive, for the same amount of energy?
- Putting the cheapness of fossil fuels into perspective, a gallon of gasoline purchased for $4 might deliver 6 kWh of mechanical energy after accounting for efficiency of the associated engine. A laborer might be expected to export 100 W of mechanical power, on average, and be limited to 8 hours per day. How many hours would it take for the laborer to accomplish the equivalent output of a gallon of gasoline? At a rate of $15/hr, how much will this cost you?
- A number of attempts to estimate the energy investment in our food arrive at the conclusion that every kcal of food we eat took 10 kcal85 85: Before fossil fuels—when food-driven of fossil fuel input energy, so that we are effectively eating our fossil fuels! As a sanity check, what fraction of our fossil fuel energy would have to go into food production in the U.S. if diets are typically 2,000 kcal/day and we use fossil fuels at a rate of 8,000 W?86 86: 80% of the 10,000 W American energy Does the answer seem plausible?
- List at least five ways in which your life benefits from fossil fuels.
- List at least three negative impacts of fossil fuels that most concern you (or explain why not, if they don’t concern you).
- Which of the possibilities from the list on page 125 (or combination thereof) seem most likely to play out, to your mind? Explain what makes you think so.
- Let’s say that Earth was originally endowed with one million flerbits,87 87: . . . a made-up thing that we presume is and that we have already used up 400,000 of them. We currently extract 15,000 per year. How long does the R/P ratio suggest the resource will last?
- Proven remaining reserves of oil, gas, and coal are 10, 8, and 20 ZJ,88 88: ZJ is zetta-Joules, or 1021 while we have used 8, 4, and 8 ZJ of each. What fraction of J. the original total fossil fuel resource have we already used, then?
- It is hard for many people to appreciate that fossil fuels will not just
muscle power was used instead—if we put in more energy than we got out, we would have starved and died out.
rate per person
irreplaceable
88: Zj is zetta-Joules, or 1021 J.
“run out one day,” because they don’t appreciate the substantial amount of work that must go into extracting the resource from a reluctant ground. What common, day-to-day personal experiences do you imagine contributes to this disconnect?89
- What analogy from everyday life can you think of that would help someone understand the idea that extraction of oil from the ground must be preceded by exploration and discovery of the resource, and that we can’t produce more than we discover?
- If the inevitable decline in fossil fuel availability is a potentially important disrupter of the status quo in the decades to come, what are some reasons it gets little attention compared to, say, climate change? No right answer here, but what do you think contributes?
89: In other words, what is your personal experience obtaining resources that can suddenly just run out?
90: Note that the shaded blue area is not the entire area under the blue curve, but has been set to equal the red area.