PASCO motion sensors (Figure 1 work by emitting sound waves (“blips”) that reflect off of surfaces – a cart or whiteboard, for example – and return to the emitter. The time delay between the emission and detection of blips, using known information about the speed of sound in air (~340 m/s), is used to compute a distance from the sensor.
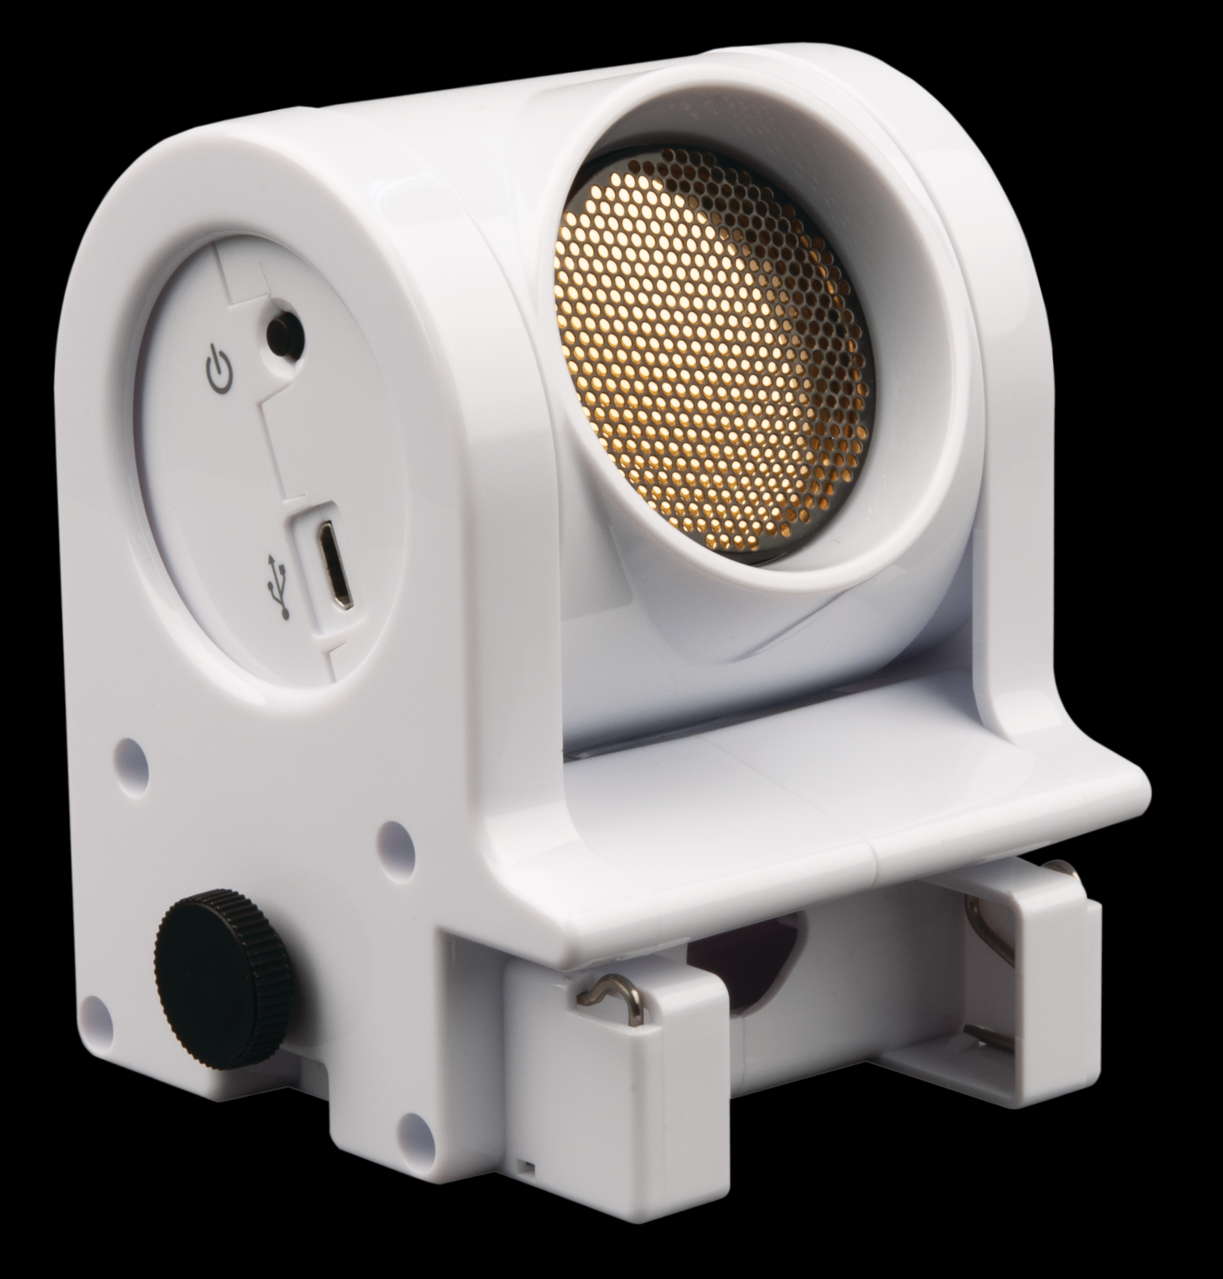
Figure 1:The Pasco wireless motion sensor.
Introduction
We will be using graphical information to understand lots of different phenomena. This experiment is begin acclimating to reading graphs. In this case, we will look at graphs describing the motion of an object (you!) as a function of time. Then, you will attempt to reproduce the graph. Once each lab partner has scored 90% or greater, you will describe the motion the graph represents.
Procedure
Open the MatchGraph program.
Connect the motion sensor to the data collection system. See Figure 2, Figure 3, and Figure 4. Choose the sensor that has the same number as your actual motion sensor. Set the motion sensor on a table or chair so that the round screen is at the height of your waist. Adjust the height by placing books under the sensor.
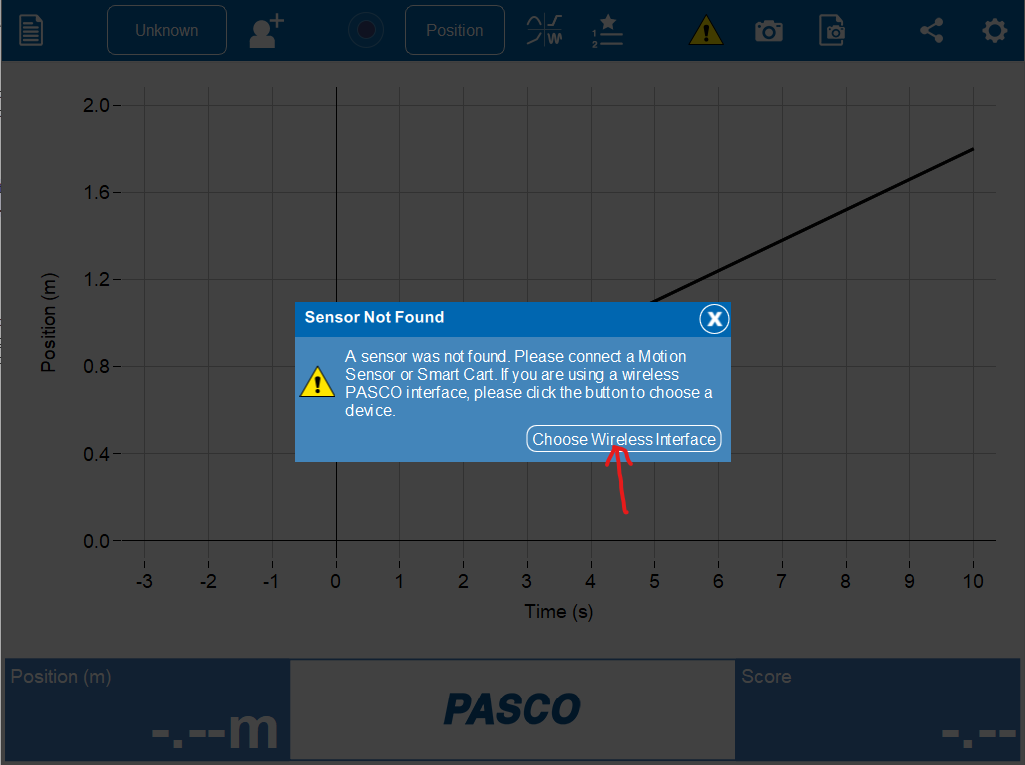
Figure 2:Click the “choose interface” button to find your motion sensor.
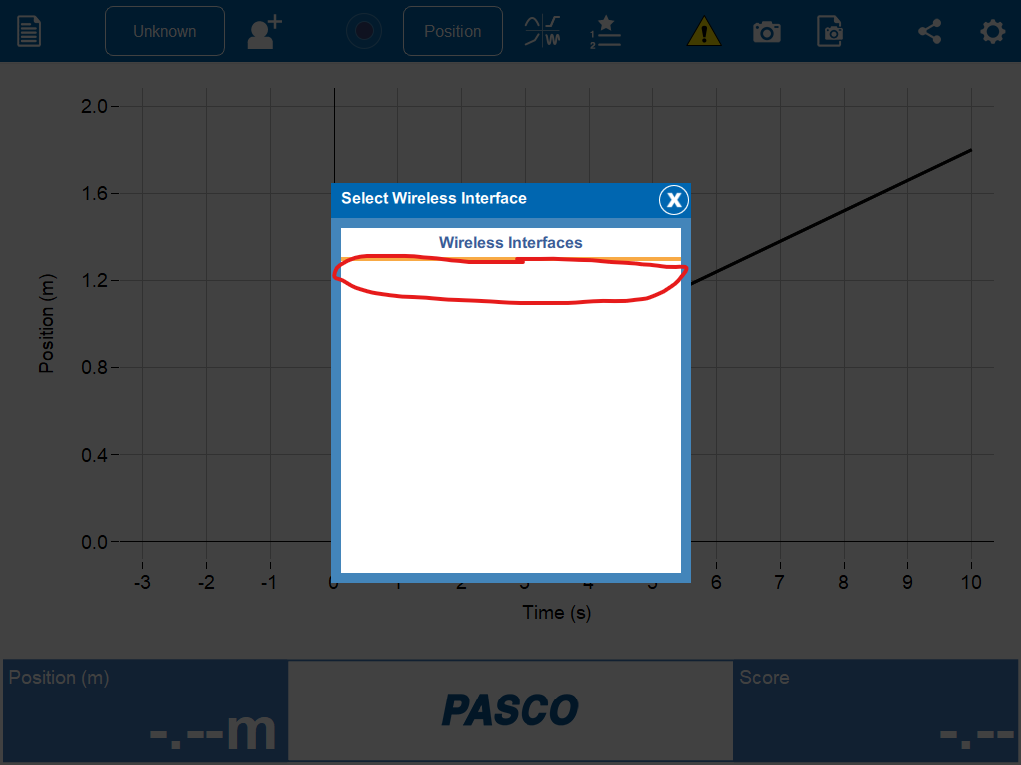
Figure 3:Select the motion sensor with the same number as the the motion sensor you have.
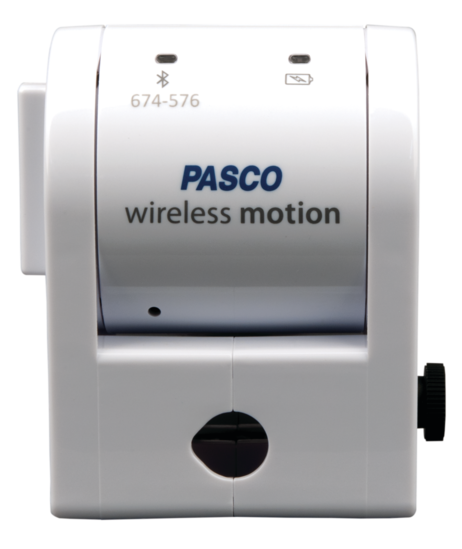
Figure 4:The Pasco wireless motion sensor has a unigue number identifier.
Clear an area in front of the motion sensor so you can walk back and forth for three or four meters while facing the sensor’s metal screen.
Begin the MatchGraph activity by selecting the Start Sampling button.
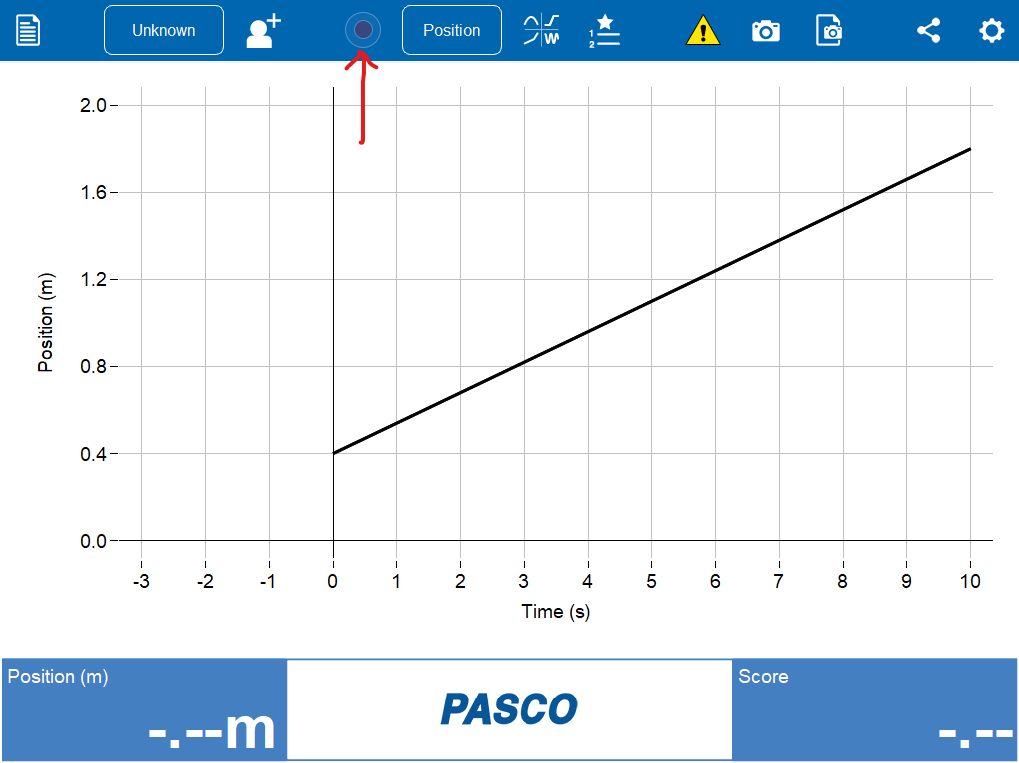
Figure 5:Click the “start sampling” button.
Change to different graph profiles using the Choose Curve Icon.

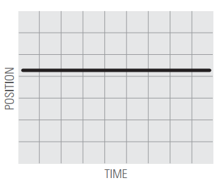
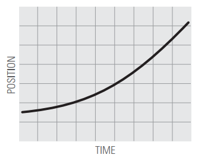
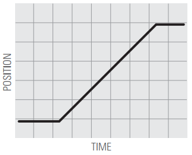
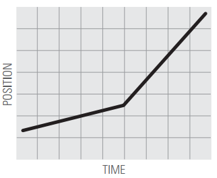
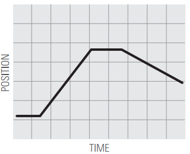
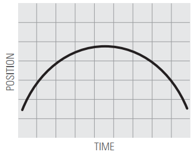
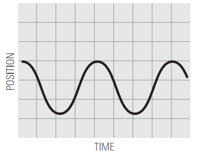
Describe the motion you used to match the position vs time graphs, using words like: distance / increases / decreases / constant / speed / speeding up / slowing down.
| Graph profile | Score | Description |
|---|---|---|
1.  | ||
2.  | ||
3.  | ||
4.  | ||
5.  | ||
6.  | ||
7.  | ||
8.  | ||
9.  |
Conclusions
Can you draw conclusions about your experiments? For example:
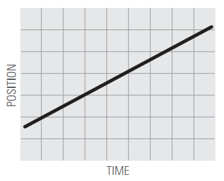
What does it mean for motion to be a straight line (graph 1) vs. a curved line (graph 5)?
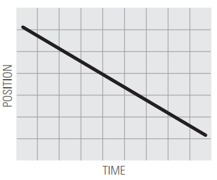
What does it mean for motion to have a positive slope (up to the right) vs. a negative slope (down to the right)?
What does it mean for the slope to be steep vs. shallow?