Start Capstone
Generally, your instructor or TAs will set up Capstone before lab. If you are setting it youself, begin by opening the Capstone software.
Capstone can collect data from multiple sensors.
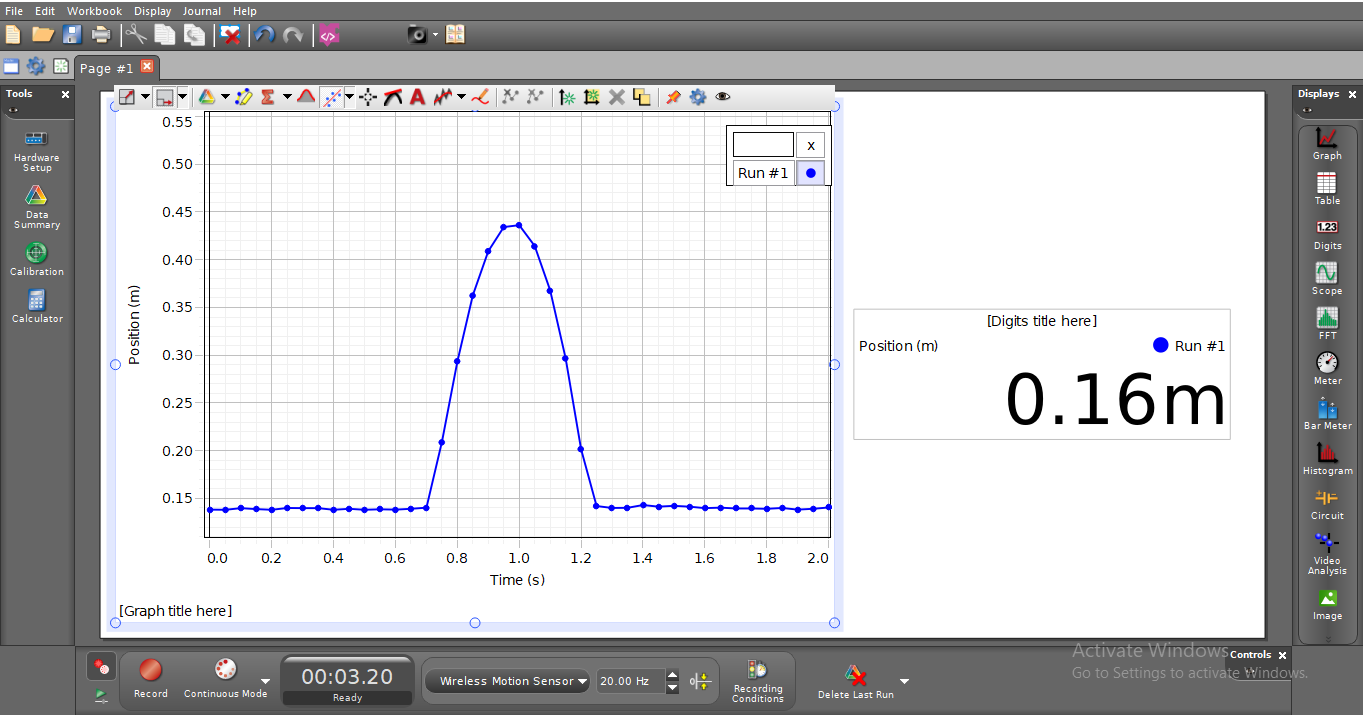
Figure 1:A screenshot of the Capstone user interface.
In Figure 1, several sensors are connected to Capstone and their values are shown as meters that can be pulled onto the screen from the right panel where the meter is labeled “Digits”. Capstone is a program that allows you to collect and analyze data from Pasco’s proprietary sensors. Among its many features, data may be manually entered from the keyboard, pasted from the clipboard, or retrieved from a file saved on disk. Capstone is also a document creator, with the ability to include several pages in one document.
With Capstone you can also:
Collect data.
Perform data analysis, such as statistical analysis, curve fitting, and calculated columns.
Add pictures to lab reports.
Add movies and synchronize movies with data collection.
Manually enter data.
Export data to Excel® or other spreadsheets.
Plot a prediction on a graph and see how well the experimental data matches it.
Acquiring Data
There are several ways to set up Capstone for an experiment. Most often you will just start using Capstone with sensors already connected.
Hardware Setup With auto‐ID sensors, all you need to do is click “Hardware setup”. The sensor will be identified, and default data‐collection parameters loaded for that sensor when you choose a sensor. Many sensors work wirelessly through bluetooth. Some are USB. You are ready to click the record button and begin data collection!
Probes & sensors experiment files If you are using an older Vernier sensor that is not auto‐ID, or if you want to use some other specially configured file, you will need the Probes & Sensors folder. Choose Open from the File menu, and open the Probes & Sensor folder. There you will find a folder for each of the Vernier sensors. Open up a file with a name that best fits the data collection you want to perform.
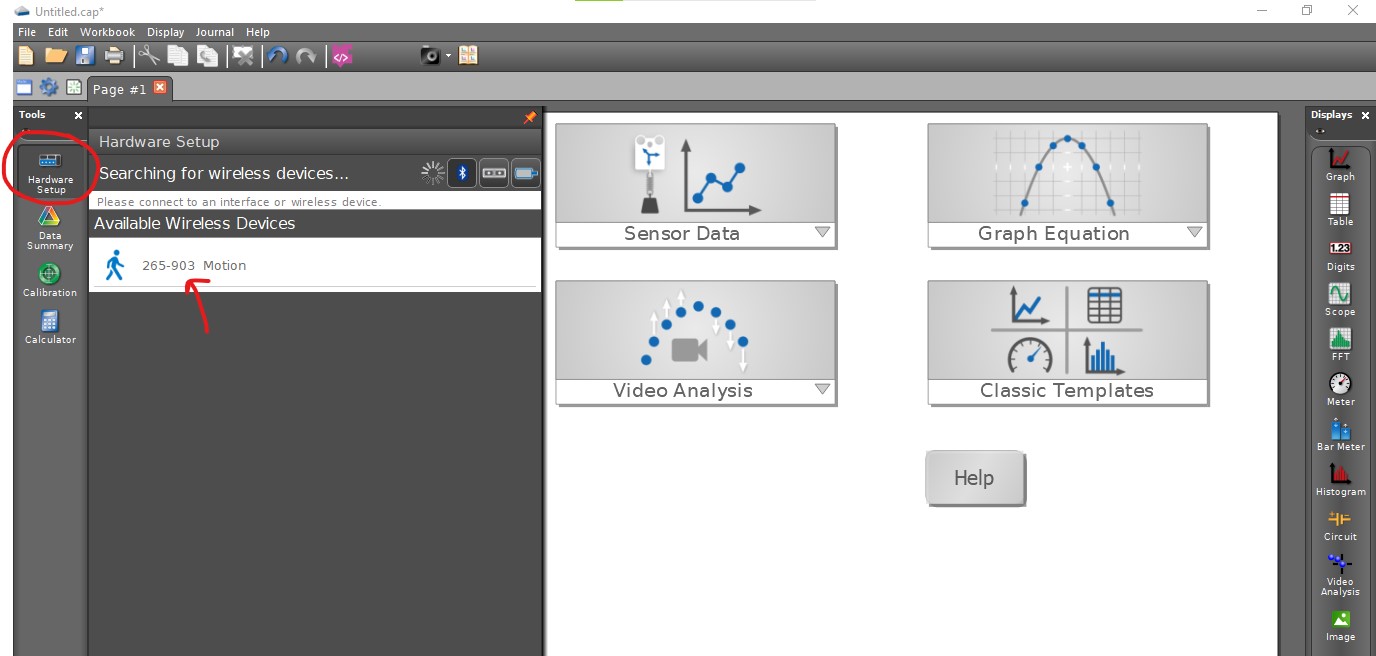
Figure 2:Add sensors by clicking the “Hardware Setup” button.
Graphs
The menu on the right allows users to drag a graph onto the screen. Then, select the x and y axis values you wish to put on the graph. This is often (but not always), a sensor measurement on the y-axis and time on the x-axis.
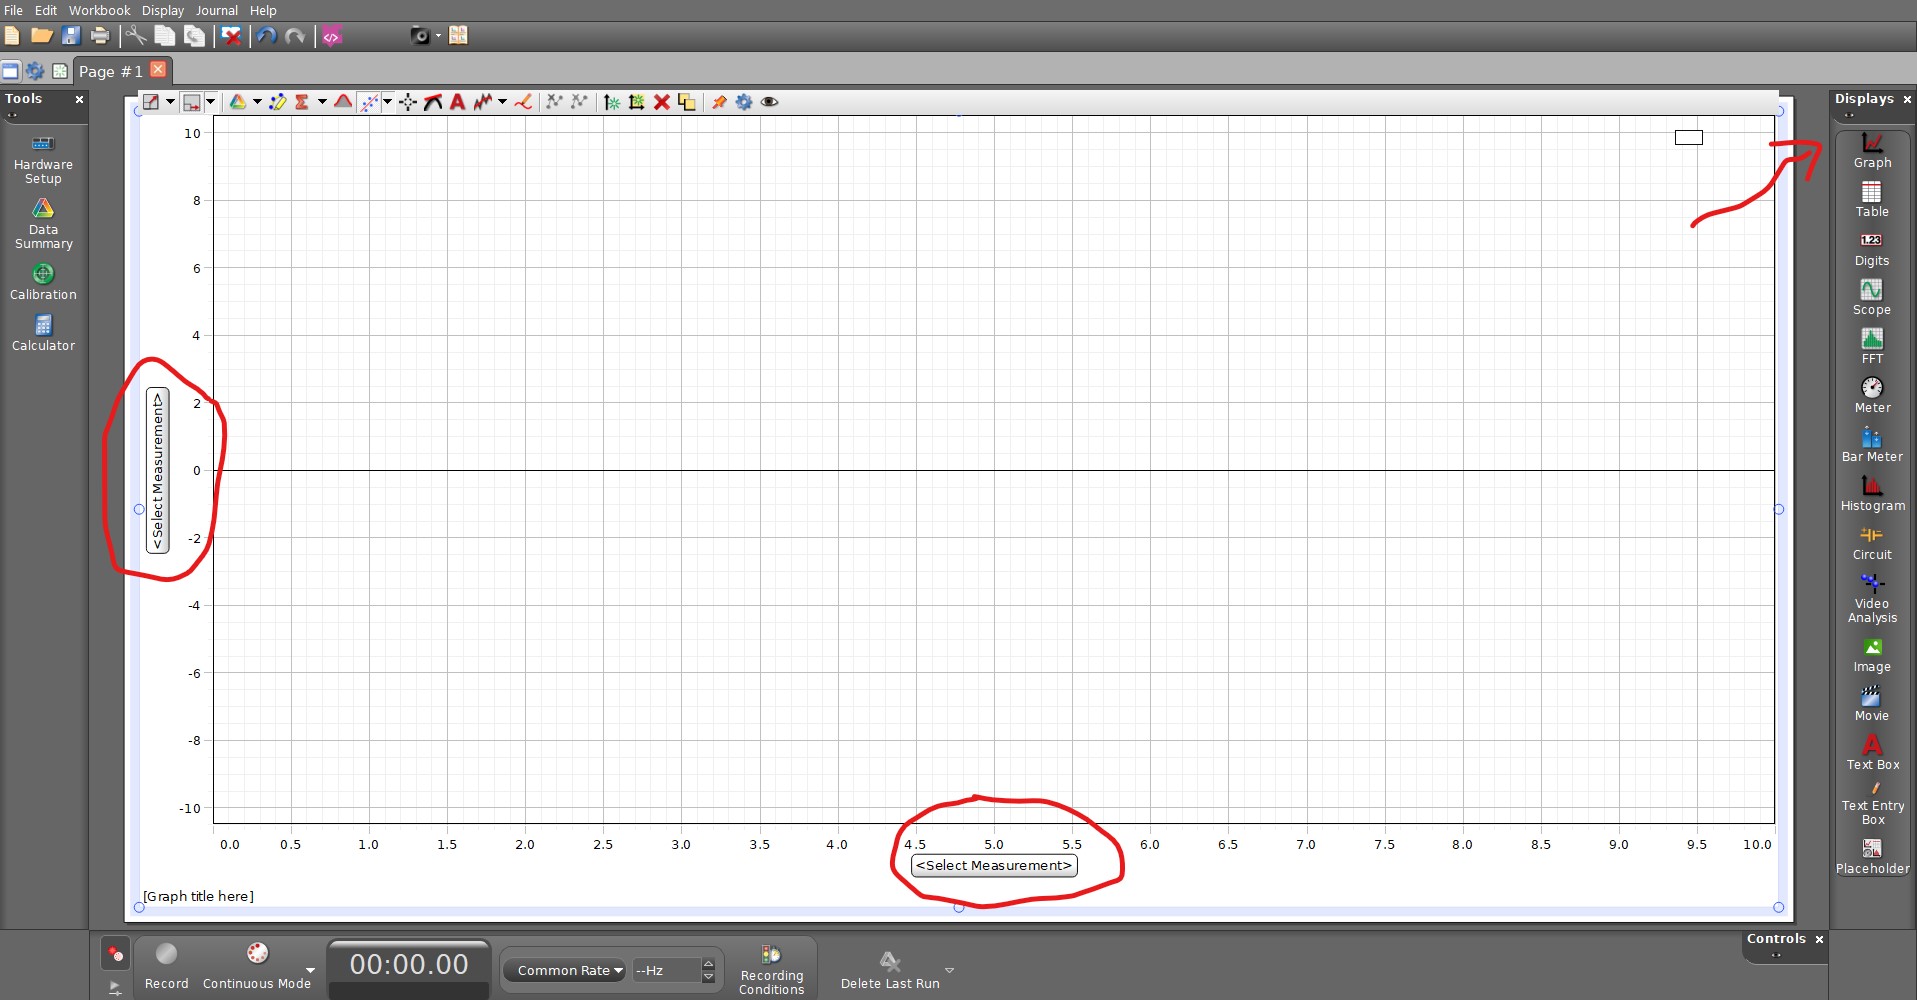
Figure 3:Add a graph of data collected.
Collect Data
Click the red record button. Capstone will begin plotting data in the graph window. You can stop the data collection early by clicking the stop button.
Now that you have collected data, there are many things you can do with it. Keep reading for descriptions of some of the most commonly‐used Logger Pro features.
Store Data
Capstone automatically saves the most recently collected data in memory as Object #, allowing you to do another collection while keeping the first one.
This can get confusing. So, be conscientious about your data collection. If you do not want to save data, simply click “Delete Last Run”.
Note: You must select Save As from the File menu to save your session (data and analysis) to disk.
Data Collection and Modes
You are not limited to time-based data collection. You can always change the axes of a graph even after you have collected data.
Manually Enter Data
You can type data directly into the data table from the keyboard. Click on a cell and type in a number. You can use the mouse or the Enter/Return key to move and edit within the table. Your values can also be plotted on a graph or used in calculations.
Pasco Help Videos
If you’d like to sutdy all of the features in Pasco Capstone software, Pasco has a series of videos you can watch https://